GBP/NZD: The GBP/NZD looks ready to recuperate

The pair recently established a significant spike up, which signals a monumental change in the underlying sentiment. After concluding a significant bearish trend, which was initiated in the wake of the initial market crash in late-March, the price action looks ready to revert its course, and start climbing back up.
Even though the underlying bullish bias is rapidly rising, this does not mean that the bulls could place their buying orders just anywhere. Instead, they might prefer to sit and wait for a new bearish correction to be established before they join the market.
The GBP/NZD has been going up for six consecutive days, which means that with each subsequent day of gains, the likelihood for the emergence of a minor retracement is increased. That is why such potential retracements encapsulate the underlying risk from buying in at the current market price in the near term.
Therefore, the purpose of today's analysis is to examine the crucial price levels associated with the presently emerging bullish trend and to sketch its most likely future progression.
Long-Term Outlook:
As can be seen on the daily chart below, the aforementioned bearish trend is represented by the downwards sloping channel – the Markdown. Once the underlying price action managed to break out above its boundaries, this signalled the termination of the downtrend and the beginning of something new.
The first considerably important price level that needs to be examined is the major resistance (presently serving as support) at 1.94800. It was the starting point of the last bullish trend, which is what makes it so relevant for the development of a new such uptrend. The breakout above this level comprises the second substantial confirmation of the rising bullish sentiment.
As regards the importance of the 1.94800 price level, there is one more thing that can be said of its relevance. It also takes the role of the 23.6 per cent Fibonacci retracement level, which makes it a likely turning point of particular interest. This is worth stressing because once the underlying price action breaks out above/below such levels, usually such steps are subsequently followed by retracements back to the support/resistance.
In other words, the bulls can use this assertion to wait for a dropdown towards the 1.94800 level, which would constitute a test for the new role of this level – that of a support. Accordingly, the bulls could go long around this level on the anticipation for continued price appreciation afterwards.
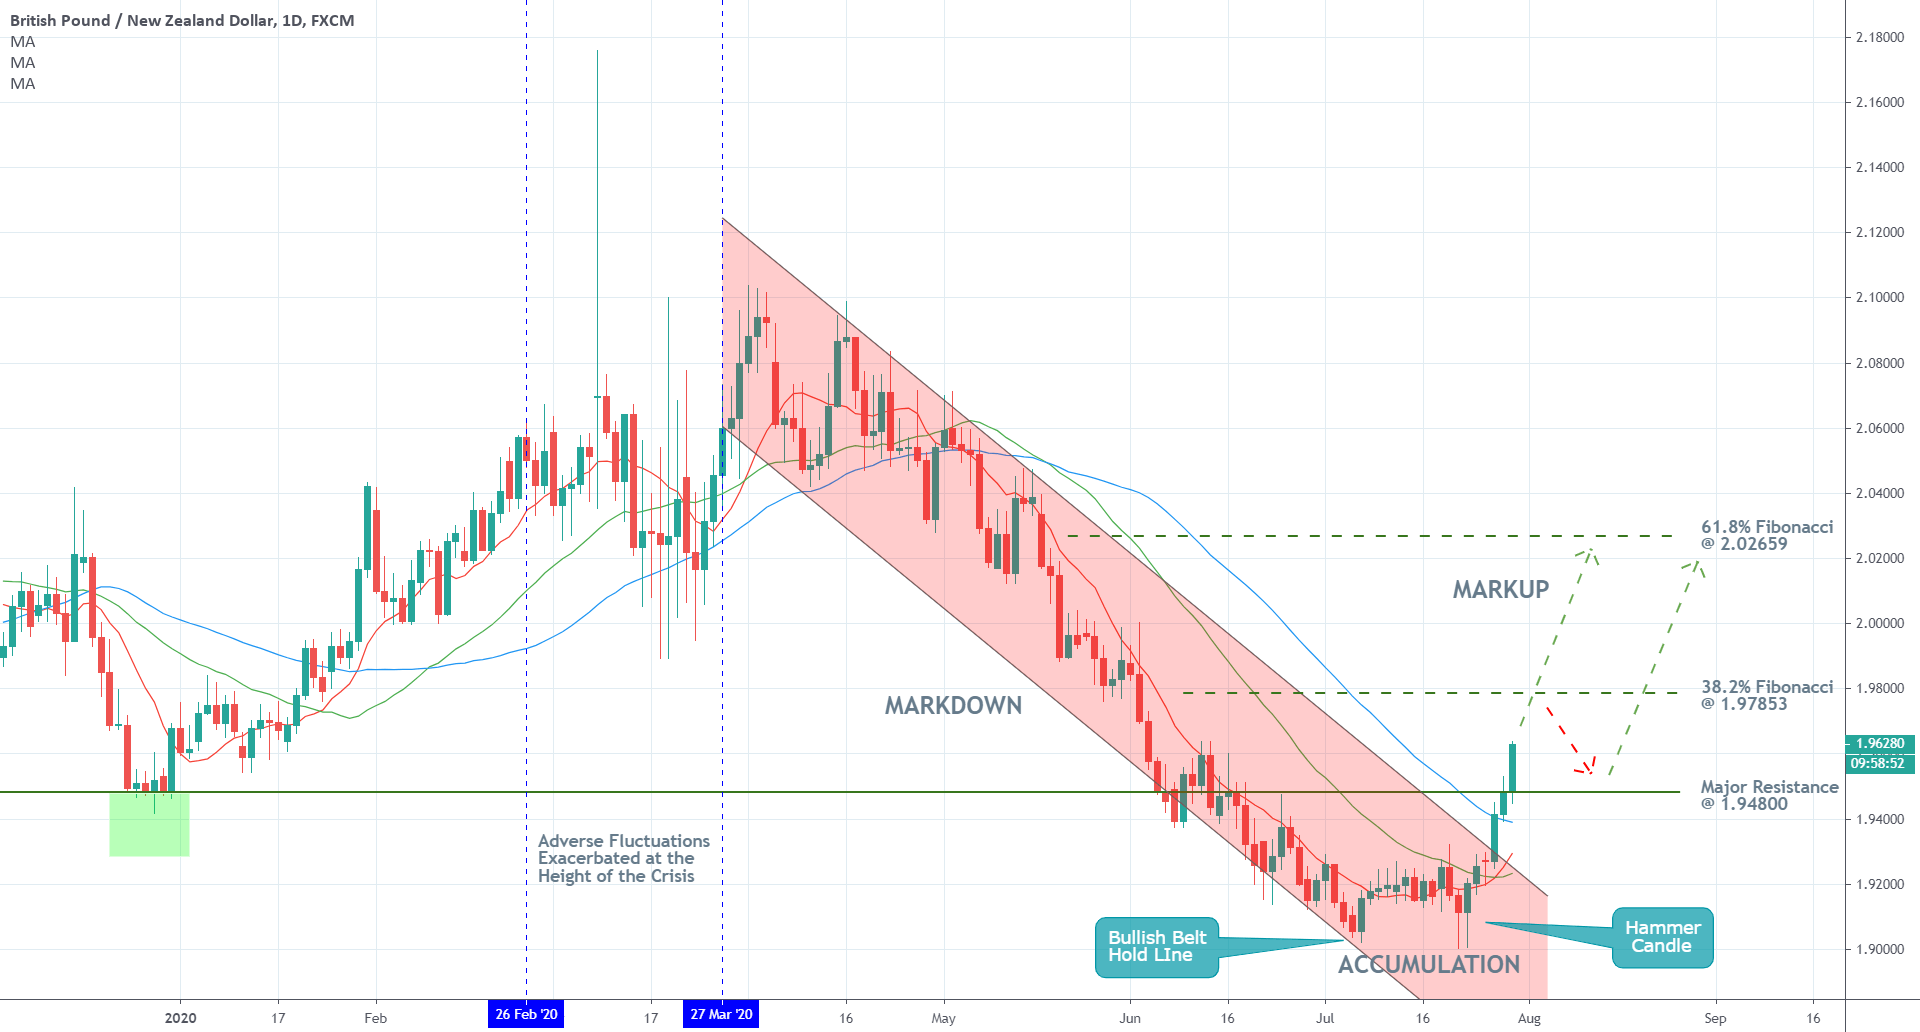
The bullish belt hold line and the hammer candlestick represent the bottom of the preceding bearish trend and the starting point of the new bullish trend, which is expected to emerge from the temporary Accumulation range.
In addition to breaking out above the downwards sloping channel's upper boundary and the major resistance at 1.94800, the price action is also trading above the three MAs as indicated on the chart. All of this demonstrates the strength of the rising bullish sentiment.
Notably, the price action is trading above the 50-day MA (in blue) for the first time since the beginning of the preceding bearish trend. Meanwhile, the 10-day MA (in red) recently crossed above the 30-day MA (in green), which comprises yet another indication of the rapidly rising bullish sentiment.
The first target level for this newly evolving uptrend is encompassed by the 38.2 per cent Fibonacci retracement level at 1.97853. Meanwhile, its longer-term goal is encapsulated by the 61.8 per cent Fibonacci retracement level at 2.02659.
Short-Term Outlook:
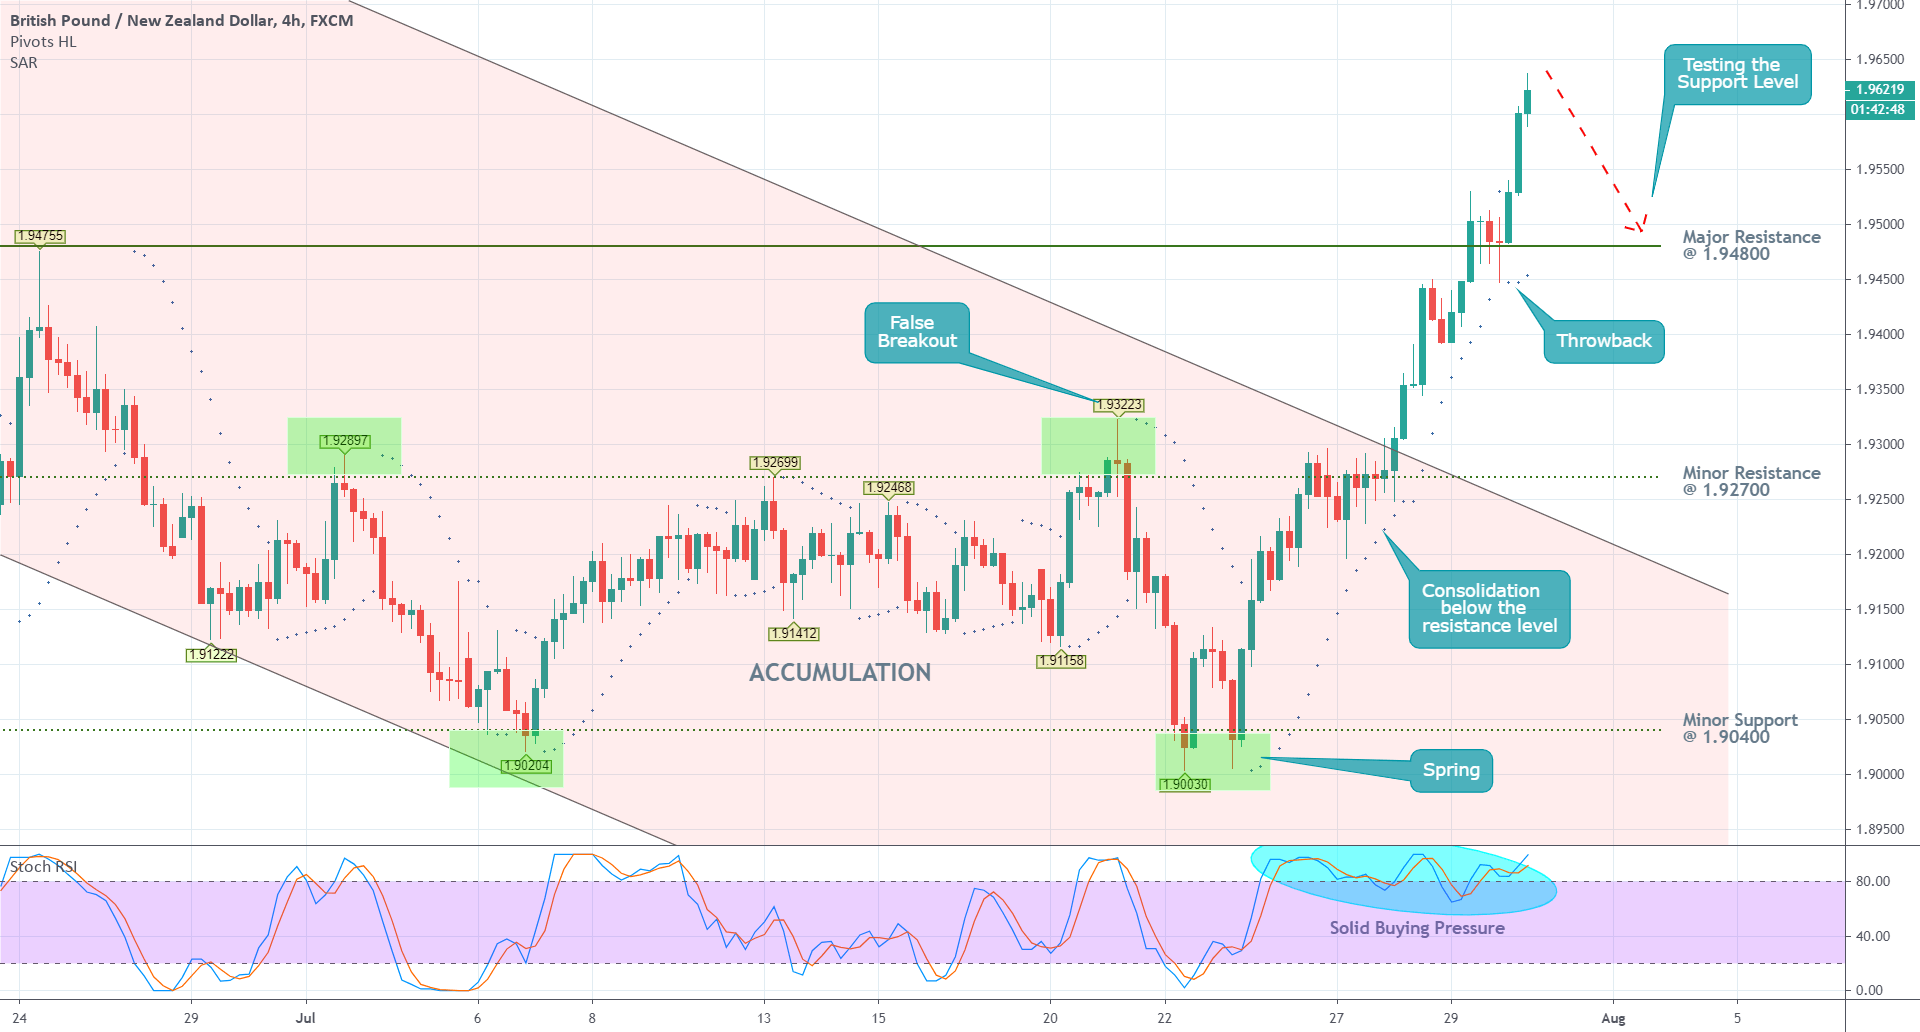
The structure of the recent upswing is further delineated on the 4H chart below. Firstly, the Parabolic SAR indicator illustrates the solid bullish momentum in the short-term. A swing high is yet to be established, which would be manifested as a pivot point. Only afterwards a new bearish correction could take place, which would subsequently set a new swing low. This would encompass a favourable entry level for the bulls.
As can be seen, the Stochastic RSI indicator has been threading within the 'Overbought' extreme pretty much since the beginning of the latest upswing. This cannot be sustained indefinitely, which means that eventually, the underlying buying pressure would have to 'take a break', allowing for such a correction to take place.
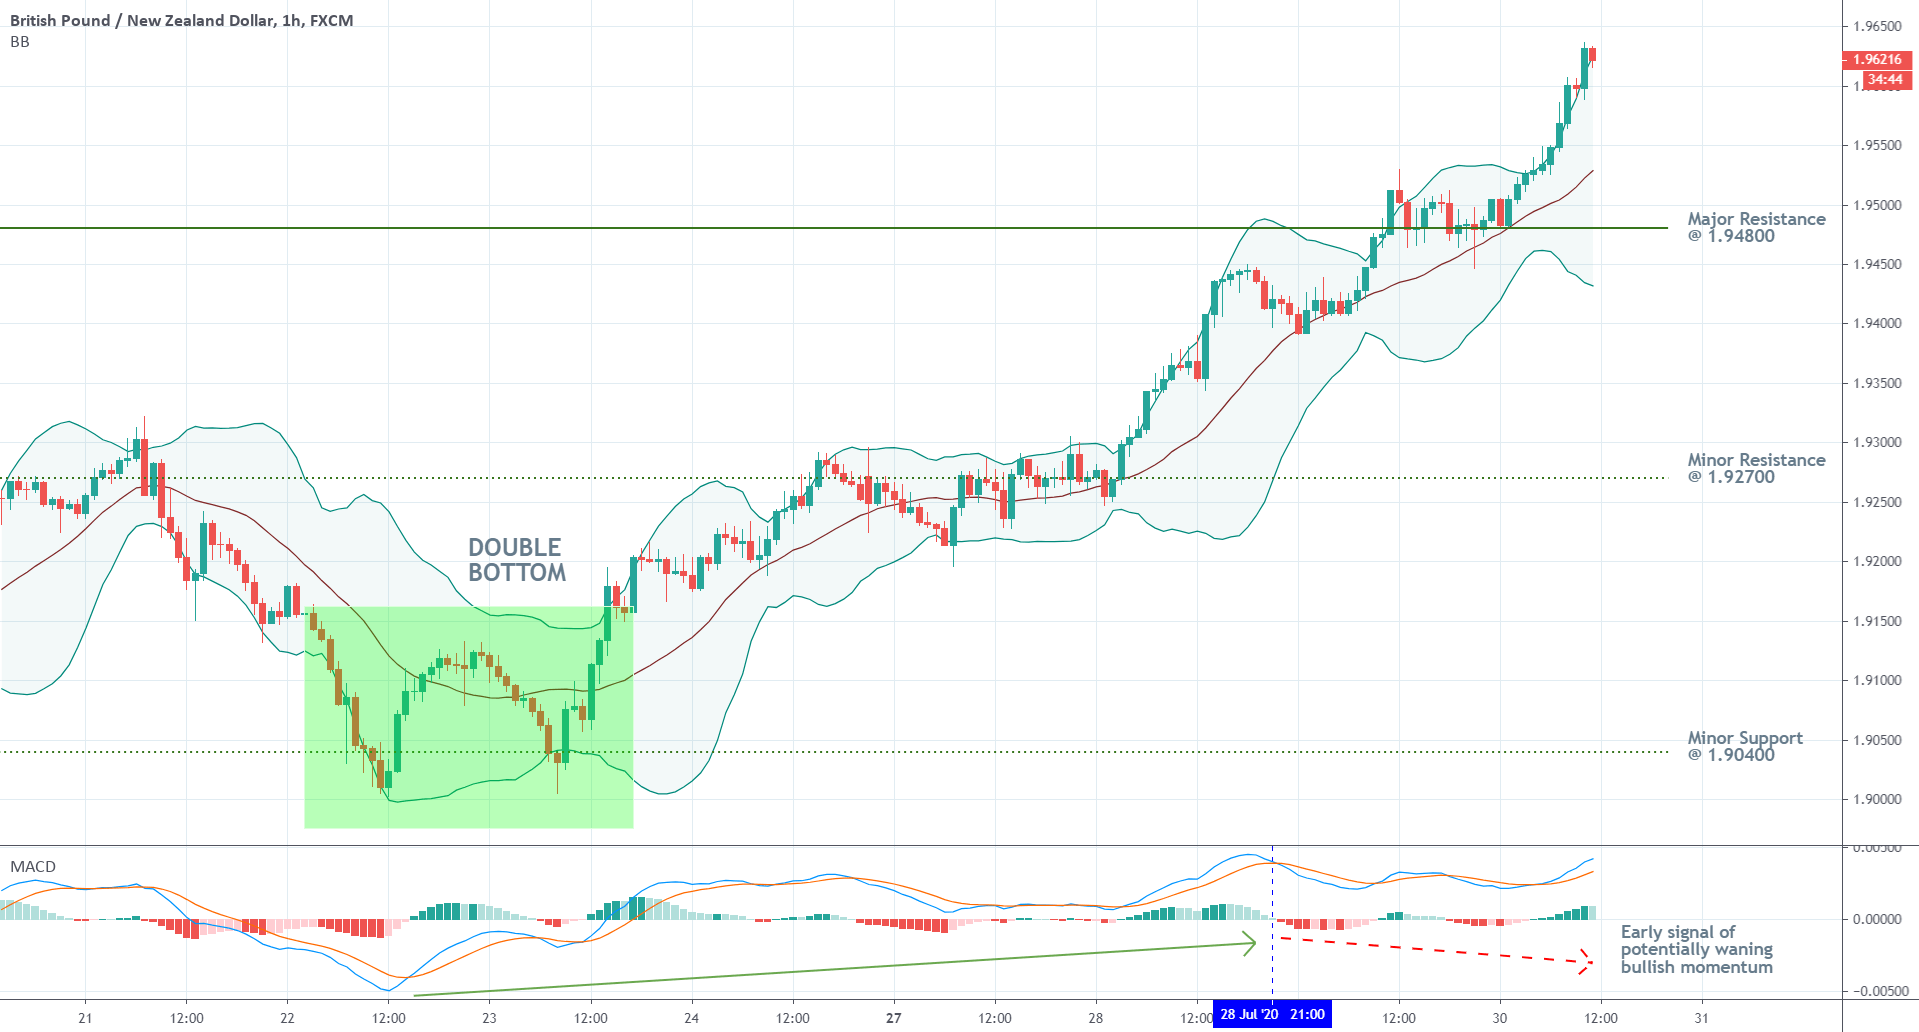
Finally, in anticipation of a new bearish correction, traders need to monitor the shape and size of the Bollinger Bands in addition to the direction of the underlying momentum, as represented by the MACD indicator. In other words, once the Bollinger Bands, which are quite wide at present, start contracting once again, this would be demonstrative of waning bullish pressures.
Meanwhile, if the two EMAs comprising the MACD start generating consecutively lower peaks, this would be manifesting a diminishing bullish momentum.
Concluding Remarks:
The GBP/NZD pair has recently concluded establishing the first major step in the development of a new bullish trend. That was the breakout above the pivotal resistance level at 1.94800.
All underlying pieces of evidence point towards the same likely conclusion – the pair is ready to develop a new bullish trend. This would naturally take days and even weeks to unfold, as the price action creates multiple swing lows and swing highs. That is why the bulls need not rush to join this new bullish trend at all costs, but rather wait for the conclusion of the first bearish correction in order to enter at a discount.
Author

Plamen Stoyanov
Trendsharks
Plamen started his career on the global capital markets in 2012 when he began trading with financial derivatives.


