$/cad nearer term outlook:
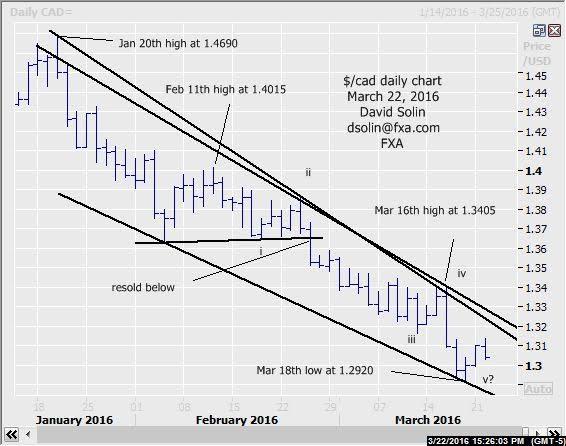
In the March 15th email once again affirmed the bearish view, adding that despite increasing positives there was still no confirmation of a low "pattern-wise" (5 waves up on shorter term chart for example). The market has indeed continued lower since, reaching a low at 1.2920 on Mar 18th (a level not seen since last Oct). No change as positives remain and include an oversold market after the decline from the Jan 20th high at 1.4690, potentially slowing downside momentum and seen within the final downleg in the decline from at least the Feb 11th high at 1.4015 (wave v). However, there is still no confirmation of even a short term bottom (and larger bottoms begin with smaller ones), and in turn leaves open scope for further downside. Remember as discussed in the past, positives are just signs of a "potential" approaching bottom and something to be aware of. However, these positives can stay in place for extended periods while the market continues lower. So generally prefer in these situations to stay with the bearish view/trend until there is confirmation of at least a near term reversal (5 waves up for example) as it would greatly increase the likelihood of a more substantial turn. Nearby support is seen at the recent 1.2915/25 low and the falling support line from Feb (currently at 1.2850/65). Nearby resistance is seen at the earlier 1.3135/50 high and the bearish trendline form Jan 18th (adjusts for that Jan 20th spike, currently at 1.3285/95). Bottom line : still no confirmation of even a short term low, but positives appearing.
Strategy/position:
Still short from the Feb 25th sell on the intraday break below 1.3620. For now would make a slight adjustment to that stop to a close 15 ticks above that bearish trendline from the Jan 18th high.
Long term outlook:
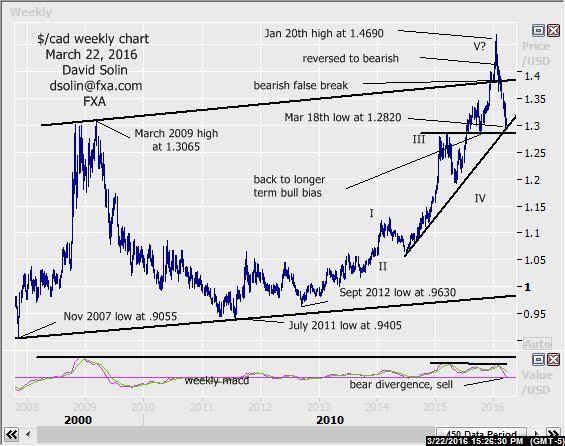
View since late Jan of a more major top (9-12 months) at that Jan 20th 1.4690 high, continues to play out. Negative long term technicals (see sell mode on the weekly macd), the bearish false break of that long mentioned 1.38/1.39 "pivotal" area (ceiling of bull channel from Nov 2007) and likely completion of the whole 5 wave rally from the Sept 2012 low at .9630 (wave V, see weekly chart/2nd chart below) support this view. But be warned, there is scope for a good sized, countertrend bounce (month and likely longer) as part of this longer term top/topping, and with some potential such a bottom may be nearing. Note that a number of commodities (inversely correlated, oil, copper, etc.) are seen in process of a multi-month period of wide ranging/bottoming and may nearing their upper end (see email from yesterday, my blog at www.fxa.com/solin/comments.htm ). Additionally, the market is within lots of long term support at 1.2720/1.2820 (recent low, bullish trendline from June 2014, broken high from march 2015, low from Oct 2015, see weekly chart/2nd chart below) and 1.2600/50 (38% retracement from the July 2011 low at 1.9405). But as discussed above, there is still no confirmation of even a short term low "pattern-wise" (and larger bottoms begin with smaller ones). Bottom line : view since late Jan of more major top remains but some rising potential for a good sized, countertrend bounce (month or 2).
Strategy/position:
Finally reversed that longer term bullish bias that was put in place Oct 15th at 1.2895 to bearish on Jan 26th at 1.4090 (1195 ticks, over 9% profit). At this point with rising potential of a bottom for at least a few weeks (and potentially more), would use the same exit as the shorter term above to switch to neutral, and maintain a good overall risk/reward in the position.
Recommended Content
Editors’ Picks
AUD/USD: Gains appear capped near 0.6580

AUD/USD made a sharp U-turn on Tuesday, reversing six consecutive sessions of gains and tumbling to multi-day lows near 0.6480 on the back of the robust bounce in the Greenback.
EUR/USD looks depressed ahead of FOMC

EUR/USD followed the sour mood prevailing in the broader risk complex and plummeted to multi-session lows in the vicinity of 1.0670 in response to the data-driven rebound in the US Dollar prior to the Fed’s interest rate decision.
Gold stable below $2,300 despite mounting fears

Gold stays under selling pressure and confronts the $2,300 region on Tuesday against the backdrop of the resumption of the bullish trend in the Greenback and the decent bounce in US yields prior to the interest rate decision by the Fed on Wednesday.
Bitcoin price tests $60K range as Coinbase advances toward instant, low-cost BTC transfers

BTC bulls need to hold here on the daily time frame, lest we see $52K range tested. Bitcoin (BTC) price slid lower on Tuesday during the opening hours of the New York session, dipping its toes into a crucial chart area.
Federal Reserve meeting preview: The stock market expects the worst

US stocks are a sea of red on Tuesday as a mixture of fundamental data and jitters ahead of the Fed meeting knock risk sentiment. The economic backdrop to this meeting is not ideal for stock market bulls.

