Analysis for April 16th, 2014
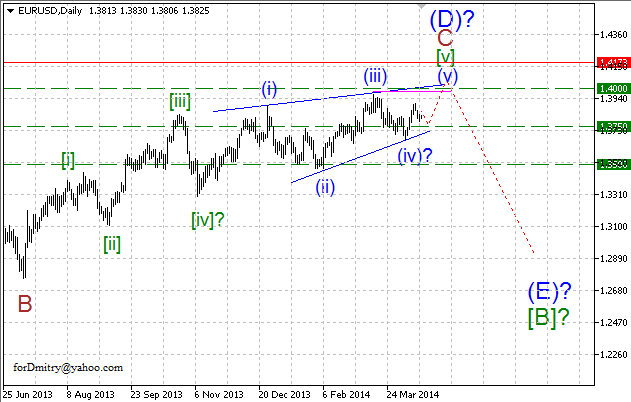
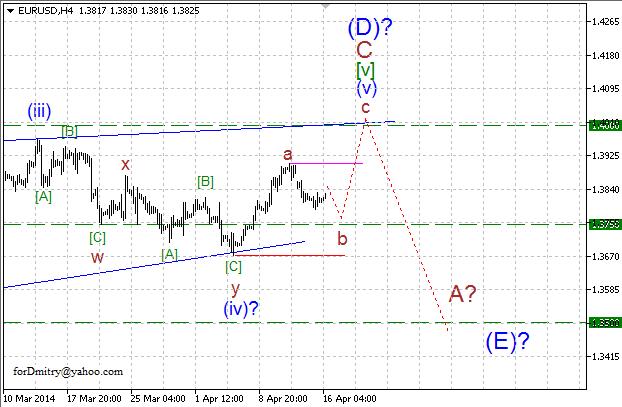
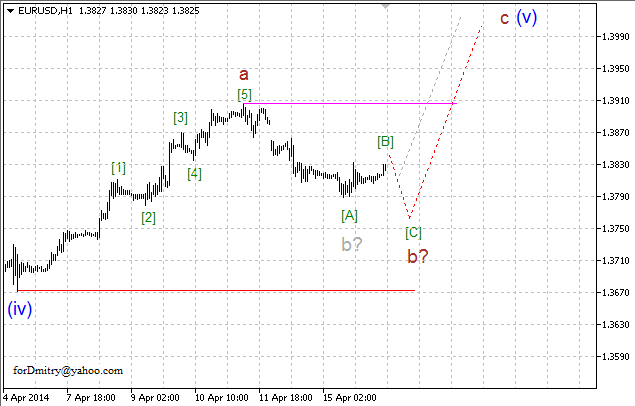
EUR USD, “Euro vs US Dollar”
Probably, Euro is finishing diagonal triangle [v] of C of (D) of ascending zigzag (D) of [B], which may be followed by final descending zigzag (E) of [B].
Probably, price is forming final ascending zigzag (v) of [v] of C of (D). Pair has already finished ascending impulse a of (v) of [v] of C of (D) and right now is forming descending correction b of (v) of [v] of C of (D).
Possibly, pair is completing local descending correction b of (v) in the form of zigzag, which may be followed by ascending wave c of (v).
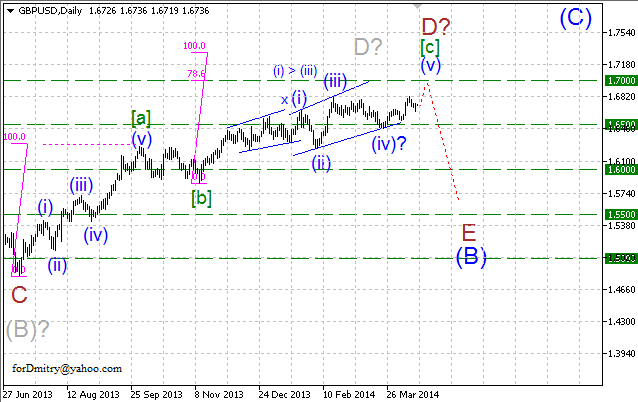
GBP USD, “Great Britain Pound vs US Dollar”
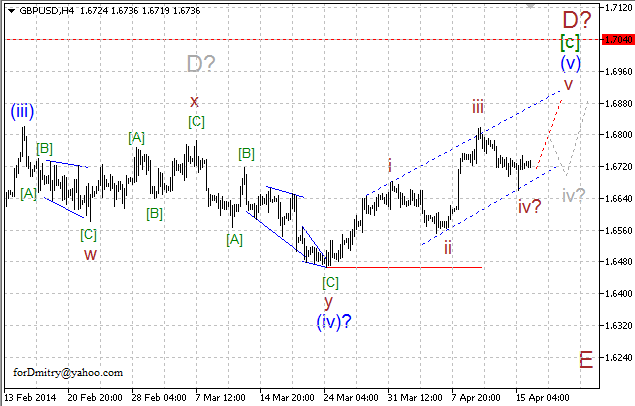
Probably, Pound is completing final wedge [c] of D of ascending zigzag D of (B) with extension in its first wave (i) of [c]. After completing zigzag D of (B), price is expected to start final descending zigzag E of (B).
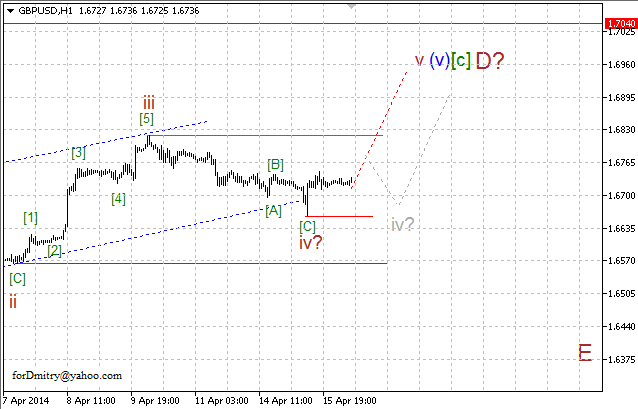
Probably, pair is finishing final ascending impulse (v) of [c] of D. Right now, price is forming ascending wave v of (v) of [c].
It looks like price is starting to form final ascending wave v of (v). However, this assumption hasn’t been confirmed yet, and pair may still be forming correction iv of (v) in the form of long horizontal pattern.
USD CHF, “US Dollar vs Swiss Franc”
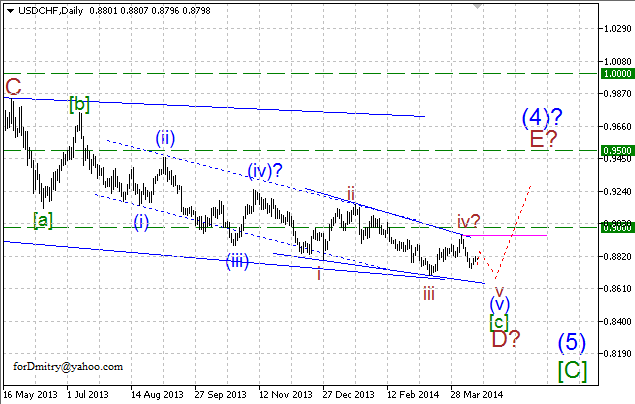
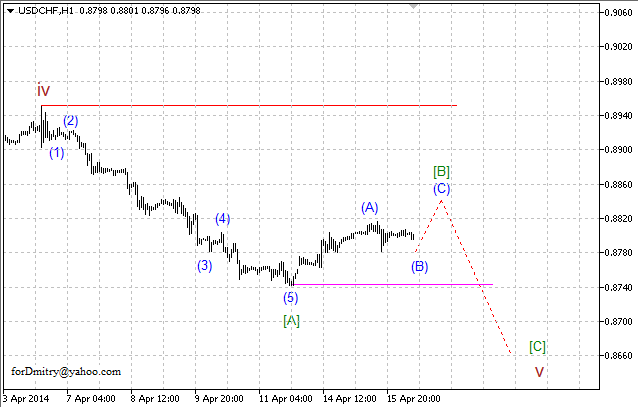
Probably, Franc is completing diagonal triangle (v) of [c] of D of descending zigzag D of (4), which may be followed by final ascending zigzag E of (4).
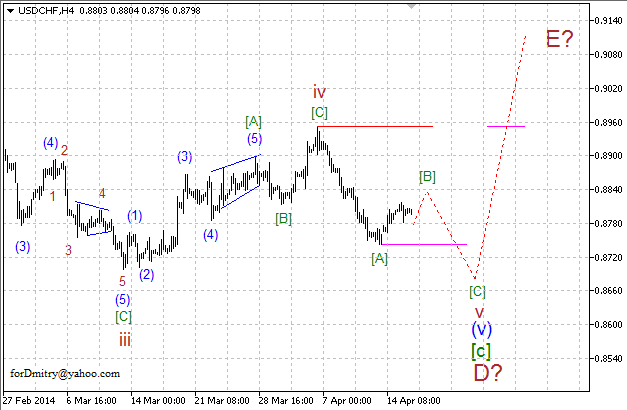
Probably, price is forming final descending zigzag v of (v) of [c] of D. Pair is completing local ascending correction [B] of v, which may be followed by descending wave [C] of v.
Possibly, price is finishing ascending correction [B] of v in the form of zigzag, which may be followed by descending impulse or diagonal triangle [C] of v.
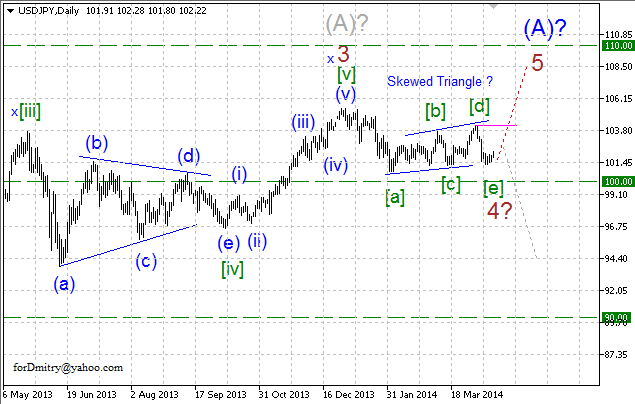
USD JPY, “US Dollar vs Japanese Yen”
Probably, Yen finished long horizontal correction 4 of (A). In this case, price is expected to start final ascending movement inside wave 5 of (A).
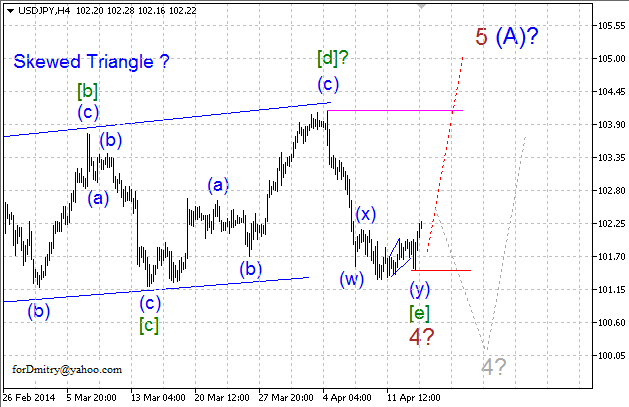
Possibly, pair completed skewed triangle 4, which may be followed by final ascending wave 5.
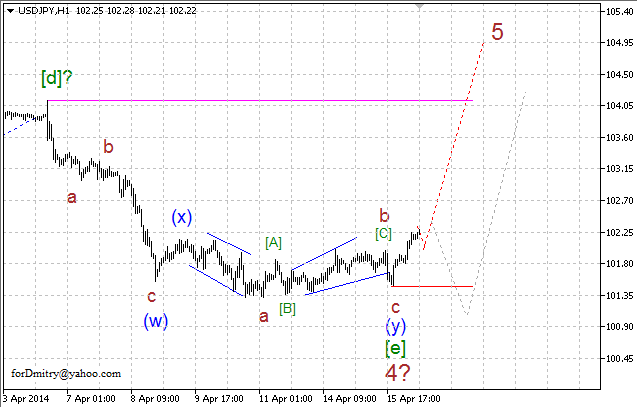
Probably, price finished descending double zigzag [e] of 4 and started forming final ascending wave 5.
Before you enter foreign exchange and stock markets, you have to remember that trading currencies and other investment products is trading in nature and always involves a considerable risk. As a result of various financial fluctuations, you may not only significantly increase your capital, but also lose it completely. Therefore, our clients have to assure RoboForex that they understand all the possible consequences of such risks, they know all the specifics, rules and regulations governing the use of investment products, including corporate events, resulting in the change of underlying assets. Client understands that there are special risks and features that affect prices, exchange rates and investment products.
Recommended Content
Editors’ Picks
AUD/USD regains the constructive outlook above the 200-day SMA

AUD/USD advanced strongly for the second session in a row, this time extending the recovery to the upper 0.6500s and shifting its focus to the weekly highs in the 0.6580-0.6585 band, an area coincident with the 100-day SMA.
EUR/USD keeps the bullish performance above 1.0700

The continuation of the sell-off in the Greenback in the wake of the FOMC gathering helped EUR/USD extend its bounce off Wednesday’s lows near 1.0650, advancing past the 1.0700 hurdle ahead of the crucial release of US NFP on Friday.
Gold stuck around $2,300 as market players lack directional conviction

Gold extended its daily slide and dropped below $2,290 in the second half of the day on Thursday. The benchmark 10-year US Treasury bond yield erased its daily losses after US data, causing XAU/USD to stretch lower ahead of Friday's US jobs data.
Bitcoin price rises 5% as BlackRock anticipates a new wave of capital inflows into BTC ETFs from investors

Bitcoin (BTC) price slid to the depths of $56,552 on Wednesday as the cryptocurrency market tried to front run the Federal Open Market Committee (FOMC) meeting. The flash crash saw millions in positions get liquidated.
FOMC in the rear-view mirror – NFP eyed

The update from May’s FOMC rate announcement proved more dovish than expected, which naturally weighed on the US dollar (sending the DXY to lows of 105.44) and US yields, as well as, initially at least, underpinning major US equity indices.
