Good afternoon, dear traders.
Today we consider the USD/CHF currency pair on the D1 chart. At the moment we can see that the price came out of the uptrend price channel and crossed the trend line downwards. The candlestick pattern “absorption” indicates the trend reversal: the body of the second bearish candlestick exceeds significantly the body of the previous white candlestick (marked in red ellipse on the chart). That means the bullish trend is weak, and now bears are gaining strength. There is no contradiction on the part of the RSI-Bars oscillator: the graphic model “double top” can be observed on the oscillator chart. It outlines the bullish trend termination and the onset of the bearish one. The current downtrend direction is confirmed by the Parabolic values. You can wait for the last confirmatory signal from DonchianChannel, when the price breaks the fractal support level at 0.9358. This mark can be used for placing a pending sell order. Stop Loss is recommended to be placed at 0.9687. The mark is confirmed by Bill Williams fractal, the upper boundary of DonchianChannel and Parabolic values.
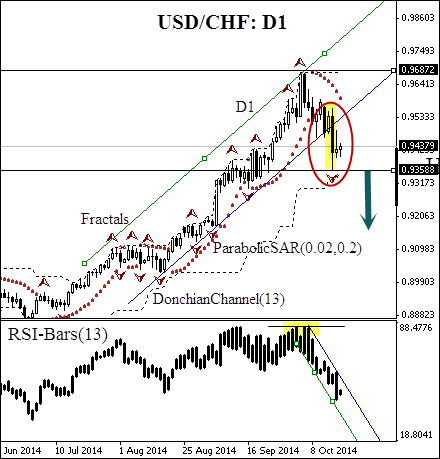
After position opening, Trailing Stop is to be moved after the Parabolic values, near the next fractal peak. Updating is enough to be done every day after the formation of 5 new H4 candlesticks, needed for the Bill Williams fractal formation. Thus, we are changing the probable profit/loss ratio to the breakeven point.
- Position Sell
- Sell stop below 0.93588
- Stop loss above 0.96872
Recommended Content
Editors’ Picks
EUR/USD declines below 1.0700 as USD recovery continues

EUR/USD lost its traction and declined below 1.0700 after spending the first half of the day in a tight channel. The US Dollar extends its recovery following the strong Unit Labor Costs data and weighs on the pair ahead of Friday's jobs report.
GBP/USD struggles to hold above 1.2500

GBP/USD turned south and dropped below 1.2500 in the American session on Thursday. The US Dollar continues to push higher following the Fed-inspired decline on Wednesday and doesn't allow the pair to regain its traction.
Gold slumps below $2,300 as US yields rebound

Gold extended its daily slide and dropped below $2,290 in the second half of the day on Thursday. The benchmark 10-year US Treasury bond yield erased its daily losses after US data, causing XAU/USD to stretch lower ahead of Friday's US jobs data.
Top 3 Price Prediction BTC, ETH, XRP: Altcoins to pump once BTC bottoms out, slow grind up for now

Bitcoin reclaiming above $59,200 would hint that BTC has already bottomed out, setting the tone for a run north. Ethereum holding above $2,900 keeps a bullish reversal pattern viable despite falling momentum. Ripple coils up for a move north as XRP bulls defend $0.5000.
Happy Apple day

Apple is due to report Q1 results today after the bell. Expectations are soft given that Apple’s Chinese business got a major hit in Q1 as competitors increased their market share against the giant Apple.