Forex Strength and Comparison for Week 17 / 2017

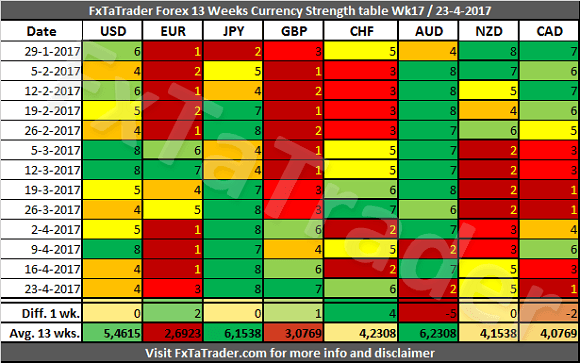
In the Currency Strength table, the JPY was again the strongest currency while the CAD was the weakest. There were some significant changes last week with the CHF gaining 4 points and the EUR 2 points. The AUD lost 5 points and the CAD 2 points. The other currencies remained around the same level of last week with a maximum difference of just 1 point.
______________________________________
13 Weeks Currency Score Strength
The 13 Weeks Currency Strength and the 13 Weeks Average are provided here below. This data and the "13 weeks Currency Classification" are considered for deciding on the preferred range. Because it is not ideal nor desired to change the range for a currency every single week, we perform several checks to avoid this.
1. First of all the strength over a period of the last 13 weeks is considered. See each row for more information.
2. Next, the 13 weeks average is considered, see the last row called "Avg. 13 wks."
3. The number of weeks that a currency was stronger than another currency can also be considered.
4. The Technical Analysis (TA) Charts for each Time Frame could also be consulted.
For analyzing the best pairs to trade looking from a longer-term perspective the last 13 weeks Currency Classification can be used in support.
This was updated on 9 April 2017 and is provided here for reference purposes:
Strong: USD, JPY, AUD. The preferred range is from 6 to 8.
Neutral: CHF, NZD, CAD. The preferred range is from 3 to 5.
Weak: EUR, GBP. The preferred range is from 1 to 2.
When looking at the Average 13 wks. Score the AUD remains the strongest of all even after having to weeks of a low score during the last 3 weeks. The EUR remains the weakest and after that the GBP which had 4 strong weeks in a row lately. The currencies are grouped together around a level which makes clear to what classification they fit best. It is clear to see in the Avg. 13 wks. values to what groups the currencies belong.
_____________________________________
Classification review
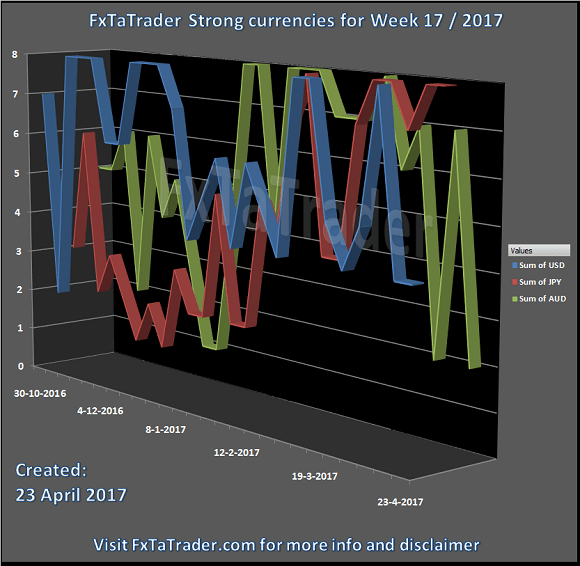
This week we take a look at the strong currencies. The AUD is very volatile lately by going in the last 4 weeks to scores of 7 and 2. These are scores resp. in the Strong and Weak range.
The USD is less volatile but is lately having more scores in the range of Neutral currencies with sometimes making a top in the range of the Strong currencies. Actually, this is the case in the last 13 weeks. In the 13 weeks before that, it was clearly almost all the time in the range of the Strong currencies.
The JPY is clearly back on track after the strong dip it had in December last year. It is the strongest currency of last week and the second strongest when looking at the Average 13 wks. score being close behind the AUD. The JPY had in the last 6 weeks 4 scores of 8 and 2 scores of 7 and in the 6 weeks before that scores within the Neutral and Strong range.
For the moment these currencies will remain strong and it seems that the JPY may become the one with the highest Average 13 wks. score in the near future. The USD is the weakest of the Strong currencies by having a score of around 0,5 point lower to the other strong currencies. However, it is still too far from the neutral currencies to become one in the near future.
Below you can see the Weekly Currency Score Chart with the 6 months' data as a reference.
_____________________________________
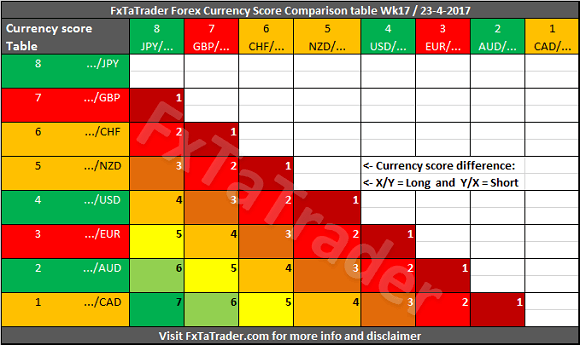
Currency Score Comparison
"Comparison table" and the "Ranking and Rating list"
The Forex Currency Comparison Table compares each currency with its counterpart based on the Currency Score. For more information about the currency Score of this week, you can read the article "Forex Ranking, Rating and Score" which is published every week together with this article.
By using the comparison table directly below you can get a view without the volatility and statistics as opposed to the "Ranking and Rating list". Only the strength of each currency against the counterparts is analyzed by using the Technical analysis charts of the 4 Time Frames that are also used for the "Ranking and Rating List".
The information from the Comparison Table is the source for calculating the "Ranking and Rating List" where this list additionally uses the volatility and statistics for creating the best and worst performer in the list from number 1 to 28.
The information is published once a week and the rates change during the week. The mentioned scores also change and different opportunities may show up during the week. There are many ways to follow the rate changes during the week. This can be done e.g. by looking at the charts of course and checking e.g. the Ichimoku and/or MACD in the Daily and 4 Hours chart. There are also many tools, apps and websites where the development of rates of currencies is shown in different automated ways. This may be by pips or percentage difference or by comparing the values of indicators like the RSI, Moving Averages, MACD, Ichimoku etc. On my blog is a Heatmap available that can be of use also.
"Comparison table" and the "Currency Score Chart"
The additional value of this table compared to the Currency Score table is that the Comparison Table compares the strength between the currencies of each pair. By subtracting the strength of the weaker currency from the stronger currency we have a way to compare each pair combination.
The comparison table provides a way to compare currencies from a longer-term perspective of 13 weeks and also simultaneously taking the current trend into account. By coloring the currencies in the X and Y axis according to their Classification we can show what the best combinations are. In doing this we apply 2 rules to make it clearer.
1. First of all, only better-classified currencies in combination with weaker classified currencies are Approved when there is a Currency Score difference of at least 1 in the current week.
2. The only exception is when 2 currencies are similarly classified but the Currency Score difference is equal to or more than 4.
3. It means that each currency should be as far apart from each other as possible in the range from 1 to 8. The classification of the currencies in question may change in the longer term. By using the difference of 4 which is exact at the half of the range it seems a safe approach for trading 2 currencies which are similarly classified.
4. Even though currencies may be in the same classification a currency may be in a weaker/stronger period and may even change its classification in the future. See the current classification for the coming period at the beginning of this article.
______________________________________
Putting the pieces together
Based on the last "13 Weeks currency classification" and the "Currency Comparison Table" the most interesting currencies for going long seem to be the:
JPY and CHF.
These are Strong or Neutral currencies from a longer term perspective when looking at the last "13 Weeks currency classification".
For going short the same analysis can be done and the following currencies seem to fit best:
EUR and CAD.
These are Weak or Neutral currencies from a longer term perspective.
Currencies with a high deviation seem less interesting to trade because they are less predictable. A good example now is/are e.g. the:
GBP and AUD.
______________________________________
Besides this article, I also use the Forex "Ranking, Rating and Score" which is also available once a week on my blog. In the article "Ranking, Rating and Score" we look in more detail at the absolute position of the currencies and pairs.
It is recommended to read the page "Currency score explained", "Introduction to the FxTaTrader Forex Models" and "Statistics and Probabilities" for a better understanding of the article. If you would like to use this article then mention the source by providing the URL FxTaTrader.com or the direct link to this article. Good luck in the coming week.
Author

Frank Oznar
FxTaTrader
Technical Analysis of the trading markets has fascinated me since the early 1990's. I was then about 25 years old. During the years my studies and work made it possible to look into Technical analysis from an economic and a scientific point of view.


