Everything Was OK Until

Good Morning Traders,
As of this writing 3:50 AM EST, here’s what we see:
US Dollar: Mar. USD is Up at 89.690.
Energies: April '18 Crude is Up at 60.78.
Financials: The Mar 30 year bond is Up 12 ticks and trading at 144.16.
Indices: The Mar S&P 500 emini ES contract is 2 ticks Higher and trading at 2773.25.
Gold: The April gold contract is trading Down at 1326.00. Gold is 11 ticks Lower than its close.
Initial Conclusion
This is not a correlated market. The dollar is Up+ and Crude is Up+ which is not normal and the 30 year Bond is trading Higher. The Financials should always correlate with the US dollar such that if the dollar is lower then bonds should follow and vice-versa. The S&P is Higher and Crude is trading Up+ which is not correlated. Gold is trading Down- which is correlated with the US dollar trading Up+. I tend to believe that Gold has an inverse relationship with the US Dollar as when the US Dollar is down, Gold tends to rise in value and vice-versa. Think of it as a seesaw, when one is up the other should be down. I point this out to you to make you aware that when we don't have a correlated market, it means something is wrong. As traders you need to be aware of this and proceed with your eyes wide open.
At this hour all of Asia trading Lower. All of Europe is also trading Lower at this hour as well.
Possible Challenges To Traders Today
-
Core Retail Sales is out at 8:30 AM EST. This is major.
-
Retail Sales is out at 8:30 AM EST. This is major.
-
PPI is out at 8:30 AM EST. This is major.
-
Core PPI is out at 8:30 AM EST. This is major.
-
Business Inventories is out at 10 AM EST. This is not major.
-
Crude Oil Inventories is out at 10:30 AM EST. This is major.
Treasuries
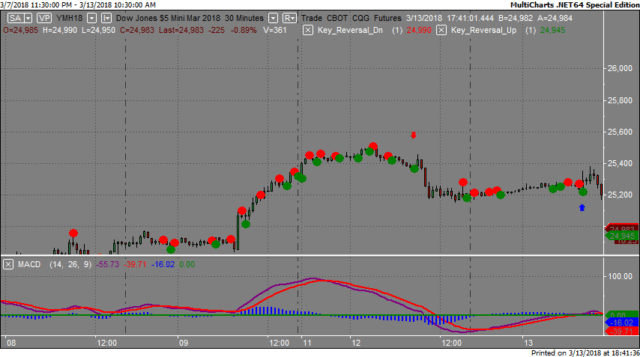
We've elected to switch gears a bit and show correlation between the 30 year bond (ZB) and The YM futures contract. The YM contract is the DJIA and the purpose is to show reverse correlation between the two instruments. Remember it's liken to a seesaw, when up goes up the other should go down and vice versa.
Yesterday the ZB made it's move at around 8 AM. The ZB hit a High at around that time and the YM hit a Low. If you look at the charts below ZB gave a signal at around 8 AM EST and the YM was moving Higher at the same time. Look at the charts below and you'll see a pattern for both assets. ZB hit a High at around 8 AM and the YM hit a Low. These charts represent the newest version of MultiCharts and I've changed the timeframe to a 30 minute chart to display better. This represented a Shorting opportunity on the 30 year bond, as a trader you could have netted about 15 plus ticks per contract on this trade. Each tick is worth $31.25.
Charts Courtesy of MultiCharts built on an AMP platform

Bias
Yesterday we gave the markets an Upside bias as Crude, the Bonds and Gold were all trading Lower and this is usually reflective of an upside day. The markets had other ideas as the Dow dropped 172 points and the other indices lost ground as well. Today we aren't dealing with a correlated market and our bias is Neutral.
Could this change? Of Course. Remember anything can happen in a volatile market.
Commentary
Yesterday we gave the markets an Upside bias as the Bonds, Gold and Crude were all trading Lower and this usually signals an upside day. Interestingly enough when the markets opened they migrated higher. However it was soon announced that President Trump decided to fire Secretary of State Rex Tillerson. Folks, this may sound like an oxymoron but the markets do not like uncertainty or anything that reeks of uncertainty. You may ask how can that be when the markets are the most uncertain environment on the planet. It is one thing when an event occurs that is beyond anyone's control (hurricane, volcano, etc.). This becomes more understandable and acceptable. It quite another when a person causes it as that's preventable. It's apparent that Trump is running the Presidency like a game of the Apprentice. Hey Prez, here's a little newsflash for you: when reporting this kind of news, do it after the market closes. Believe me you'll be saving all of us a lot of money.
Author

Nick Mastrandrea
Market Tea Leaves


