EUR/USD Weekly Forecast: US employment and European inflation data to set the tone
- Easing price pressures in the United States weighed on the US Dollar ahead of the weekly close.
- Tepid European data puts the European Central Bank between a wall and a hard place.
- EUR/USD retains the bullish tone in the mid-term, although buyers still hesitate.

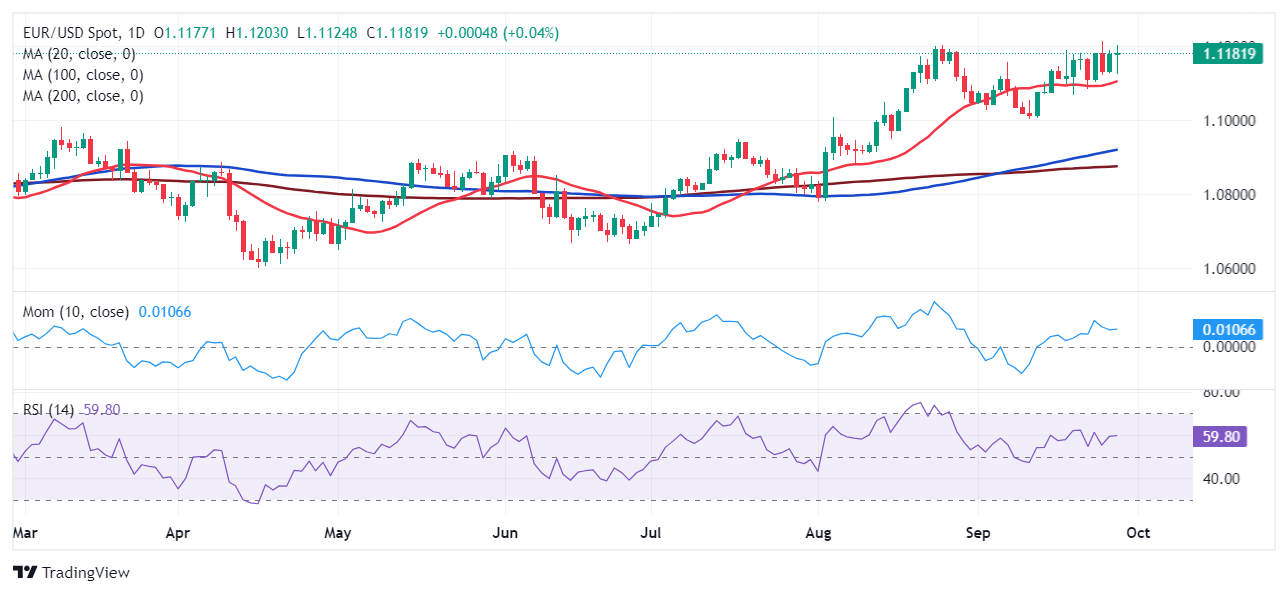
The EUR/USD pair ends a mostly uneventful week trading near the 1.1200 mark, still battling to conquer the level. It managed to post a fresh 2024 high of 1.1213 mid-week, but sellers around it have rejected EUR/USD once again.
Concerns about European economic progress, or, better said, the lack of it, as well as mounting speculation that the United States (US) Federal Reserve (Fed) could maintain the aggressive approach to interest rate cuts, kept investors in a cautious mode.
What happened
The EUR/USD pair struggled for direction most of the week, as tepid European macroeconomic figures kept Euro gains limited despite the broad US Dollar (USD) weakness.
The Eurozone September Hamburg Commercial Bank (HCOB) flash Purchasing Managers Indexes (PMIs) came in worse than anticipated, signaling a continued setback in the region. The German economy sunk “deeper into contraction,” according to the official report, as the Composite PMI fell for a fourth consecutive month to 47.2 from 48.4 in August. The manufacturing index shrank to 40.3, while services output barely held within expansion levels, still declining from 51.2 previously to 50.6.
Additionally, the EU Composite PMI declined to 48.9, missing the 50.6 expected, with the manufacturing sector performing the worst. “The fall in output was the first in seven months and was registered amid a sustained reduction in new orders. In fact, new business decreased at the sharpest pace since January,” according to HCOB.
Meanwhile, the German IFO Survey on Business Climate fell to 85.4 in September from the previous 86.6, with a deterioration of both expectations and the assessment of the current situation.
The news spurred speculation the European Central Bank (ECB) will have to keep trimming interest rates to avoid a recession.
Things were not much better in the US. The S&P Global PMIs showed that manufacturing output contracted in September, albeit the services index was broadly stable at a strong 55.4.
Also, the Conference Board's (CB) Consumer Confidence Index unexpectedly fell to 98.7 in September after printing at 105.6 in August. Even further, the Present Situation Index fell by 10.3 points to 124.3, while the Expectations Index declined by 4.6 points to 81.7 but remained above 80. Readings below it usually anticipate a recession. As a result, market participants lifted bets the Fed could trim interest rates by 50 basis points (bps) once again in November.
By the end of the week, however, US data was a bit more encouraging. The country confirmed the Q2 Gross Domestic Product (GDP) at 3% as previously estimated, while Durable Goods Orders were broadly unchanged in August, better than the 2.6% decline anticipated.
Finally on Friday, the country published the Personal Consumption Expenditures (PCE) Price Index. The Fed’s favorite inflation gauge rose by 2.2% year-over-year (YoY) in August, slightly below the market's expectation of 2.3%. On a monthly basis, the PCE Price Index increased by 0.1%, aligning with analysts' predictions. At the same time, the core PCE Price Index rose by 2.7% YoY, while the monthly growth was 0.1%, below expectations.
Finally, consumer confidence in the US improved in September, with the University of Michigan's Consumer Sentiment Index edging higher to 70.1 from 67.9 in August. This reading came in above the market expectation of 69.3. “Sentiment appears to be building some momentum as consumers’ expectations for the economy brighten,” the report reads.
EU inflation and US employment under the spotlight
The focus shifts to Europe at the beginning of next week, as Germany and the Eurozone will publish the preliminary estimates of their respective September Harmonized Index of Consumer Prices (HICP).
By Wednesday, investors will be looking at US employment data. The country will release the ADP Employment Report, indicating the number of private jobs created in September. The US will also release different labor market figures ahead of the Nonfarm Payrolls (NFP) report on Friday, a key indicator of the labor market as a whole that can hint at the Fed’s next monetary policy decision.
In between, the US will release the ISM Manufacturing Purchasing Managers Index (PMI) and the Services PMI for September.
By the end of the week, market participants will have a clearer picture of the state of the American economy and, hence, take positions accordingly.

EUR/USD technical outlook
The risk for EUR/USD skews to the upside, according to technical readings in the weekly chart. The pair posted a higher high and a higher low, usually reflecting buyers' dominance. At the same time, it keeps developing above all its moving averages. The 20 and 100 Simple Moving Averages (SMAs) head north below the 1.0900 mark, while a mildly bearish 200 SMA provides dynamic support at around 1.1040. Finally, technical indicators remain well above their mid-lines, although they are losing their upward strength. These currently consolidate near-overbought readings but without signs of upward exhaustion.
The daily chart shows EUR/USD could extend gains but it is conditional to a clear break above the 1.1200 mark. A bullish 20 SMA grind higher at around 1.1100, providing dynamic support. The 100 SMA, in the meantime, extends its advance above a flat 200 SMA far below the shorter one, reflecting persistent upward pressure. Finally, the Momentum indicator aims north well above the 100 level, while the Relative Strength Index (RSI) indicator consolidates at around 59, not enough to confirm a bullish run.
The EUR/USD pair could find support at around 1.1050 if the 1.1100 region gives up, with scope then to fall towards the 1.1000 threshold. On the other hand, a clear break above 1.1200 could see the pair initially running towards 1.1240 and then to the 1.1300 region, with a longer-term aim of 1.1470.
Economic Indicator
Nonfarm Payrolls
The Nonfarm Payrolls release presents the number of new jobs created in the US during the previous month in all non-agricultural businesses; it is released by the US Bureau of Labor Statistics (BLS). The monthly changes in payrolls can be extremely volatile. The number is also subject to strong reviews, which can also trigger volatility in the Forex board. Generally speaking, a high reading is seen as bullish for the US Dollar (USD), while a low reading is seen as bearish, although previous months' reviews and the Unemployment Rate are as relevant as the headline figure. The market's reaction, therefore, depends on how the market assesses all the data contained in the BLS report as a whole.
Read more.Next release: Fri Oct 04, 2024 12:30
Frequency: Monthly
Consensus: 145K
Previous: 142K
Source: US Bureau of Labor Statistics
America’s monthly jobs report is considered the most important economic indicator for forex traders. Released on the first Friday following the reported month, the change in the number of positions is closely correlated with the overall performance of the economy and is monitored by policymakers. Full employment is one of the Federal Reserve’s mandates and it considers developments in the labor market when setting its policies, thus impacting currencies. Despite several leading indicators shaping estimates, Nonfarm Payrolls tend to surprise markets and trigger substantial volatility. Actual figures beating the consensus tend to be USD bullish.
US Dollar PRICE This week
The table below shows the percentage change of US Dollar (USD) against listed major currencies this week. US Dollar was the strongest against the Euro.
| USD | EUR | GBP | JPY | CAD | AUD | NZD | CHF | |
|---|---|---|---|---|---|---|---|---|
| USD | -0.14% | -0.63% | -0.73% | -0.58% | -1.79% | -2.08% | -0.95% | |
| EUR | 0.14% | -0.55% | -0.58% | -0.43% | -1.72% | -1.91% | -0.83% | |
| GBP | 0.63% | 0.55% | 0.04% | 0.12% | -1.18% | -1.37% | -0.28% | |
| JPY | 0.73% | 0.58% | -0.04% | 0.17% | -1.14% | -1.31% | -0.32% | |
| CAD | 0.58% | 0.43% | -0.12% | -0.17% | -1.17% | -1.49% | -0.40% | |
| AUD | 1.79% | 1.72% | 1.18% | 1.14% | 1.17% | -0.18% | 0.90% | |
| NZD | 2.08% | 1.91% | 1.37% | 1.31% | 1.49% | 0.18% | 1.11% | |
| CHF | 0.95% | 0.83% | 0.28% | 0.32% | 0.40% | -0.90% | -1.11% |
The heat map shows percentage changes of major currencies against each other. The base currency is picked from the left column, while the quote currency is picked from the top row. For example, if you pick the US Dollar from the left column and move along the horizontal line to the Japanese Yen, the percentage change displayed in the box will represent USD (base)/JPY (quote).
Author

Valeria Bednarik
FXStreet
Valeria Bednarik was born and lives in Buenos Aires, Argentina. Her passion for math and numbers pushed her into studying economics in her younger years.