- EUR/USD dropped further and broke below 1.0900 on Thursday.
- The Dollar remained well bid on firm US labour market prints.
- Concerns over a potential US economic slowdown dwindled further.
EUR/USD faced additional selling pressure, adding to the weekly leg lower and revisiting the sub-1.0900 yardstick, or four-day lows. The pair’s negative price action was driven by the ongoing recovery of the US Dollar (USD) and a generally positive sentiment in global stock markets.
That said, the USD Index (DXY) continued its upward trajectory, moving above the 103.50 level and bolstered by a further depreciation of the Japanese yen and another positive day for US yields across the board.
Contributing to the positive outlook for the USD, concerns over an inter-meeting rate cut by the Fed dissipated. This shift was reinforced by robust prints from weekly US Initial Jobless Claims (+233K) as well as by recent remarks from some Fed officials, who suggested that markets may have overreacted to recent US Nonfarm Payrolls readings (+114K in July). They also downplayed the likelihood of a recession while hinting at potential rate cuts to prevent such an outcome.
Meanwhile, in the German fixed-income space, 10-year bund yields continued their weekly rise, although they seem to struggle to overcome the 2.30% barrier for the time being.
Regarding the Fed and the USD, market expectations for a 50 bps rate cut in September still remained in place, with CME Group’s FedWatch Tool indicating nearly a 54% probability of such a move, down from around 65% on the previous day.
If the Fed proceeds with more significant rate cuts, the policy gap between the Fed and the ECB could narrow in the medium term, potentially supporting further gains for EUR/USD.
However, in the long term, the US economy is expected to outperform its European counterpart, suggesting that any weakness in the USD may be temporary.
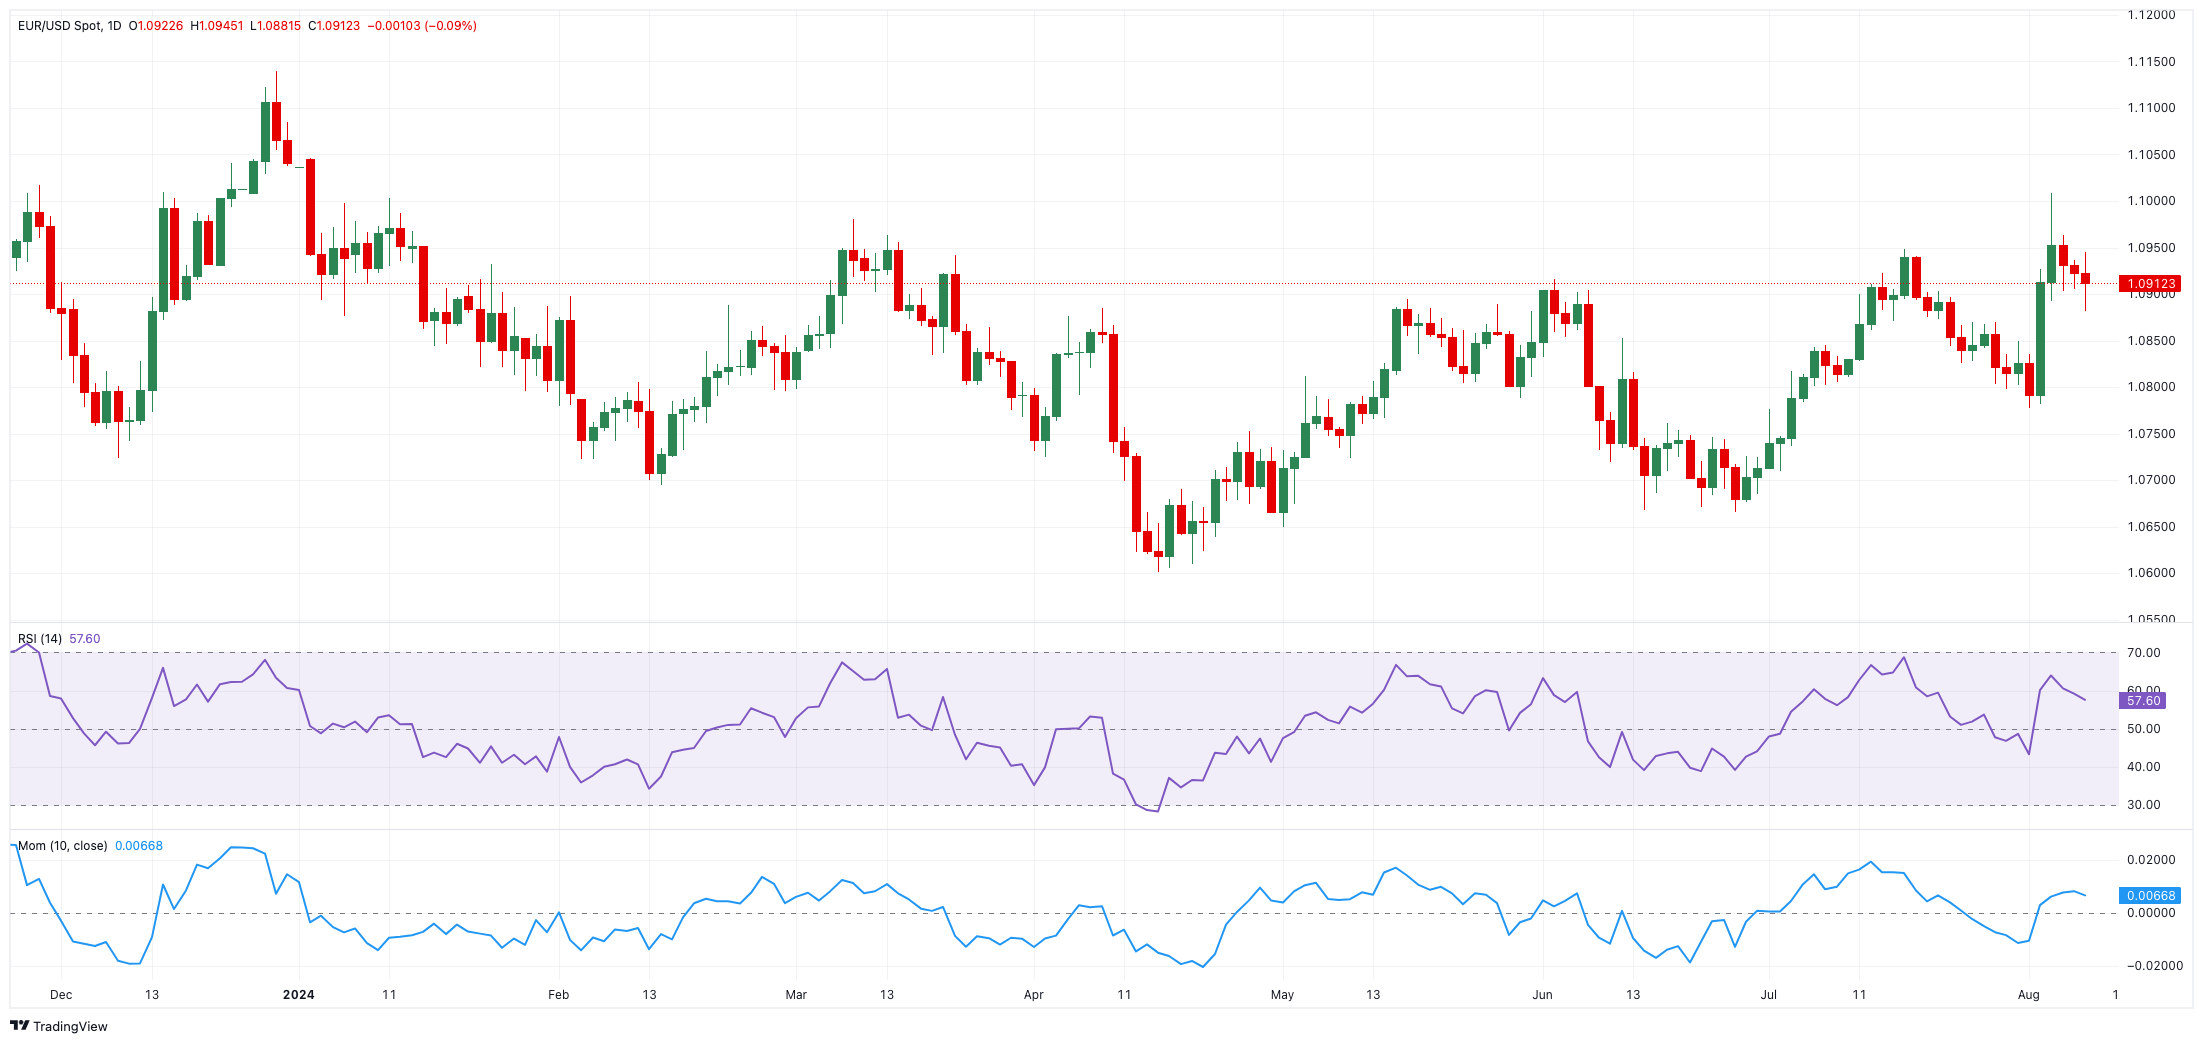
EUR/USD daily chart
EUR/USD short-term technical outlook
Further north, EUR/USD is likely to test the August high of 1.1008 (August 5), ahead of the December 2023 top of 1.1139 (December 28).
On the downside, the pair's next objective is the 200-day SMA at 1.0832, which precedes the weekly low of 1.0777 (August 1) and the June low of 1.0666 (June 26), all prior to the May low of 1.0649 (May 1).
Looking at the big picture, the pair's positive bias should hold if it continues to trade above the crucial 200-day SMA.
So far, the four-hour chart shows some erratic price action. The initial resistance level is at 1.1008 ahead of 1.1132. On the other hand, immediate contention is at 1.0881 ahead of the 200-SMA of 1.0835, and then 1.0777. The relative strength index (RSI) settled around 50.
Information on these pages contains forward-looking statements that involve risks and uncertainties. Markets and instruments profiled on this page are for informational purposes only and should not in any way come across as a recommendation to buy or sell in these assets. You should do your own thorough research before making any investment decisions. FXStreet does not in any way guarantee that this information is free from mistakes, errors, or material misstatements. It also does not guarantee that this information is of a timely nature. Investing in Open Markets involves a great deal of risk, including the loss of all or a portion of your investment, as well as emotional distress. All risks, losses and costs associated with investing, including total loss of principal, are your responsibility. The views and opinions expressed in this article are those of the authors and do not necessarily reflect the official policy or position of FXStreet nor its advertisers. The author will not be held responsible for information that is found at the end of links posted on this page.
If not otherwise explicitly mentioned in the body of the article, at the time of writing, the author has no position in any stock mentioned in this article and no business relationship with any company mentioned. The author has not received compensation for writing this article, other than from FXStreet.
FXStreet and the author do not provide personalized recommendations. The author makes no representations as to the accuracy, completeness, or suitability of this information. FXStreet and the author will not be liable for any errors, omissions or any losses, injuries or damages arising from this information and its display or use. Errors and omissions excepted.
The author and FXStreet are not registered investment advisors and nothing in this article is intended to be investment advice.
Recommended Content
Editors’ Picks

Gold leaps toward $3,450 as Israel launches attacks on Iran
Gold price rises to over five-month highs, nearing $3,450 in the Asian trading hours on Friday. Israel confirmed strikes on Iran's nuclear facilities, fuelling a broad wave of risk aversion while driving the safe-haven Gold price through the roof. Rising Fed rate cut bets also underpin the non-yielding Gold.

AUD/USD remains heavy below 0.6500 amid intense risk aversion on Israel-Iran confict
AUD/USD is off the low but remains heavy below 0.6500 in Friday's risk-off Asian affair. Trump's fresh tariff news and escalating Israel-Iran geopolitical tensions weigh on investors' sentiment and the risk-sensitive Aussie. Broad US Dollar rebound also adds to the pair's downside.

USD/JPY holds losses near 143.00 amid geopolitical risks
USD/JPY keeps the red near 143.00, reversing a quick dip to the 142.80 region in Asian trading on Friday. The global risk sentiment takes a hit amid an escalation of geopolitical tensions in the Middle East, which boosts the Japanese Yen's safe-haven status.

Solana dips 10% despite DeFi Development Corp's plan to raise $5 billion to boost SOL treasury
Solana is down 10% on Thursday after DeFi Development Corporation announced an equity line of credit agreement with RK Capital Management to raise $5 billion in sales of its shares to stack additional SOL.

US tariffs here to stay, trade deals ‘largely symbolic’
Despite legal challenges to IEEPA tariffs, US trade policy remains firm. Tariffs on steel and aluminium have doubled, and new sectoral tariffs are expected. Trade deals may emerge, but most will be symbolic. Effective tariff rates will stay high throughout 2025.