- EUR/USD receded further and flirted with the 200-day SMA.
- The Dollar retreated on the back of strong JPY appreciation.
- Flash PMIs signalled some flattening of business activity in the bloc.
The US Dollar (USD) charted decent losses on Wednesday, especially vs. the Japanese yen, dragging the USD Index (DXY) to the boundaries of the 104.00 level amidst mixed developments in US yields across the spectrum.
In that context, EUR/USD dropped to fresh lows near 1.0820, an area close to the critical 200-day SMA, although it later managed to stage an acceptable comeback and reach the 1.0850 zone amidst marginal gains in German 10-year bund yields.
Extra weakness in the single currency also followed disheartening prints from advanced Manufacturing and Services PMIs in both Germany and the euro bloc for the month of July, showing business activity in the region appears to have met difficulties to rebound further.
Back to monetary policy, a September interest rate cut by the Federal Reserve (Fed) appears fully anticipated, with investors also expecting another reduction in December. In this context, market participants might shift their focus to the US political scene, especially after current Vice President K. Harris garnered significant support to face Republican candidate D. Trump in the November 5 elections.
In the Eurozone, it is worth recalling that the ECB’s Luis de Guindos hinted at a possible interest rate cut in September.
Meanwhile, the policy divergence between the Fed and the ECB is expected to remain almost unchanged going forward, as both central banks are forecast to cut rates after the summer break. However, the steady view of a soft landing in the US economy seems to contrast with some loss of momentum in the Eurozone's economic recovery, all morphing into potential extra weakness in EUR/USD in the latter part of the year.
Looking ahead, key US GDP figures and US PCE data are expected to influence market sentiment in the second half of the week.
EUR/USD daily chart
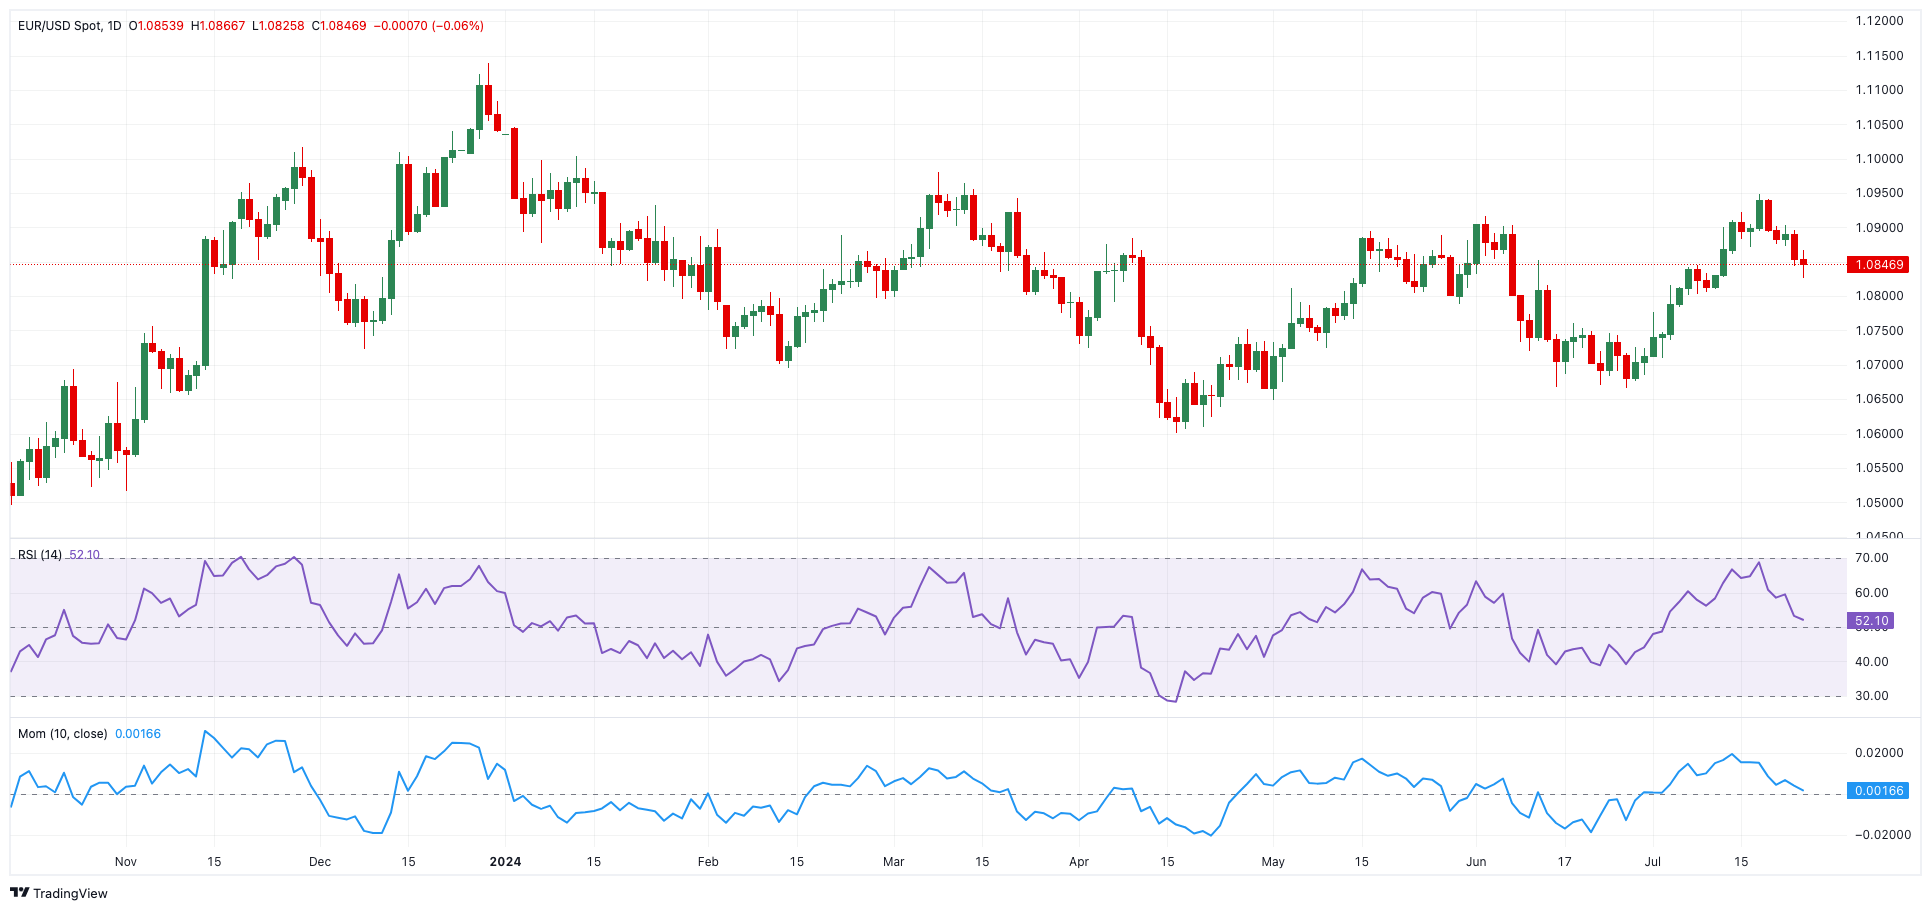
EUR/USD short-term technical outlook
Next on the downside for EUR/USD emerges the important 200-day SMA of 1.0816 before the June low of 1.0666 (June 26). The breach of the May low of 1.0649 (May 1) could open the door to a probable visit to the 2024 bottom of 1.0601 (April 16).
On the other side, initial resistance appears at the July high of 1.0948 (July 17), seconded by the March top of 1.0981 (March 8) and the critical 1.1000 milestone.
Looking at the big picture, the positive bias should hold if the pair stays above the crucial 200-day SMA.
So far, the four-hour chart indicates that the downturn could have met some decent contention. Nonetheless, the initial resistance is the 55-SMA at 1.0890 ahead of 1.0948, then 1.0981 and 1.1000. On the other side, 1.0825 is first, followed by the 200-SMA at 1.0792, and finally 1.0709. The relative strength index (RSI) decreased to about 36.
Information on these pages contains forward-looking statements that involve risks and uncertainties. Markets and instruments profiled on this page are for informational purposes only and should not in any way come across as a recommendation to buy or sell in these assets. You should do your own thorough research before making any investment decisions. FXStreet does not in any way guarantee that this information is free from mistakes, errors, or material misstatements. It also does not guarantee that this information is of a timely nature. Investing in Open Markets involves a great deal of risk, including the loss of all or a portion of your investment, as well as emotional distress. All risks, losses and costs associated with investing, including total loss of principal, are your responsibility. The views and opinions expressed in this article are those of the authors and do not necessarily reflect the official policy or position of FXStreet nor its advertisers. The author will not be held responsible for information that is found at the end of links posted on this page.
If not otherwise explicitly mentioned in the body of the article, at the time of writing, the author has no position in any stock mentioned in this article and no business relationship with any company mentioned. The author has not received compensation for writing this article, other than from FXStreet.
FXStreet and the author do not provide personalized recommendations. The author makes no representations as to the accuracy, completeness, or suitability of this information. FXStreet and the author will not be liable for any errors, omissions or any losses, injuries or damages arising from this information and its display or use. Errors and omissions excepted.
The author and FXStreet are not registered investment advisors and nothing in this article is intended to be investment advice.
Recommended Content
Editors’ Picks

AUD/USD climbs closer to 0.6500 as Israel-Iran ceasefire boosts risk sentiment
AUD/USD recovers further toward 0.6500 early Tuesday amid a positive turnaround in global risk sentiment, bolstered by the Israel-Iran ceasefire announcement. This, along with the revival of Fed rate cut bets, weighs heavily on the safe-haven US Dollar, lending support to the pair for the second consecutive day.

USD/JPY extends the pullback below 145.50 amid a weaker US Dollar
USD/JPY extends the sharp retracement from 148.00 for the second consecutive day on Tuesday amid a broad US Dollar weakness. Fed Governor Bowman pointed to the possibility of a rate cut in July. Meanwhile, the Iran-Israel ceasefire also undermines the USD, adding to the pair's downside ahead of Fed Chair Powell's two-day congressional testimony.

Gold awaits Powell amid Iran-Israel ceasefire, July Fed rate cut talks
Gold price bounces-off nine-day lows near $3,335 early Tuesday on reviving July Fed rate cut talks. US Dollar corrects sharply from the monthly top on a Iran-Israel ceasefire and dovish Fed expectations. XAU/USD looks to Fed Powell’s testimony as the 50-day SMA is tested; the daily RSI teases the midline.

SEI, WIF, VIRTUAL post double-digit gains amid Israel-Iran ceasefire
The Israel-Iran ceasefire announcement fuels a sudden recovery in the broader cryptocurrency market, with Bitcoin reclaiming $105,000. Altcoins such as Sei, Dogwifhat, and Virtuals Protocol are leading the market by double-digit gains on Tuesday.

Could Iran block the Strait of Hormuz? Why Oil is on edge after US strikes
As the Israel-Iran conflict reaches new heights, an old threat is coming back to haunt the markets: that of the closure of the Strait of Hormuz. This narrow arm of the sea in the Persian Gulf, wedged between Iran to the north and the United Arab Emirates and Oman to the south, is much more than a simple sea passage.

The Best brokers to trade EUR/USD
SPONSORED Discover the top brokers for trading EUR/USD in 2025. Our list features brokers with competitive spreads, fast execution, and powerful platforms. Whether you're a beginner or an expert, find the right partner to navigate the dynamic Forex market.