EUR/USD Forecast: Temporary recovery?
- EUR/USD regained the 1.0700 yardstick and beyond.
- The Dollar remained well on the defensive on Tuesday.
- Firm PMIs in Euroland underpinned the EUR.

Another retracement in the US Dollar (USD) prompted EUR/USD to resume its recovery and surpass the key barrier at 1.0700 the figure on turnaround Tuesday.
The data-driven sell-off in the Greenback followed discouraging advanced prints of US PMIs in March and came amidst further reassessment by investors of the potential timing of a Federal Reserve (Fed) rate cut, now expected to happen later than previously anticipated, potentially in September, though the possibility of a move in July has not been entirely dismissed.
The resurgence of bearish sentiment in the Greenback coincided with ongoing decline in US yields across various timeframes and a consistent narrative highlighting the divergence in monetary policy between the Fed and other G10 central banks, particularly the European Central Bank (ECB).
Against this backdrop, recent statements from Board members leaned towards the initiation of the bank's easing cycle in June, with speculation circulating about three interest rate cuts (or 75 basis points) for the rest of the year. Conversely, the Fed is projected to make its first interest rate reduction in September, although the likelihood of a similar move in July cannot be ruled out entirely.
Looking forward, the relatively subdued economic fundamentals in the Eurozone, coupled with the resilience of the US economy, reinforce expectations for a stronger Dollar in the medium term, especially considering the possibility that the ECB may begin rate cuts before the Fed. In such a scenario, EUR/USD is expected to undergo a more pronounced decline in the short term.
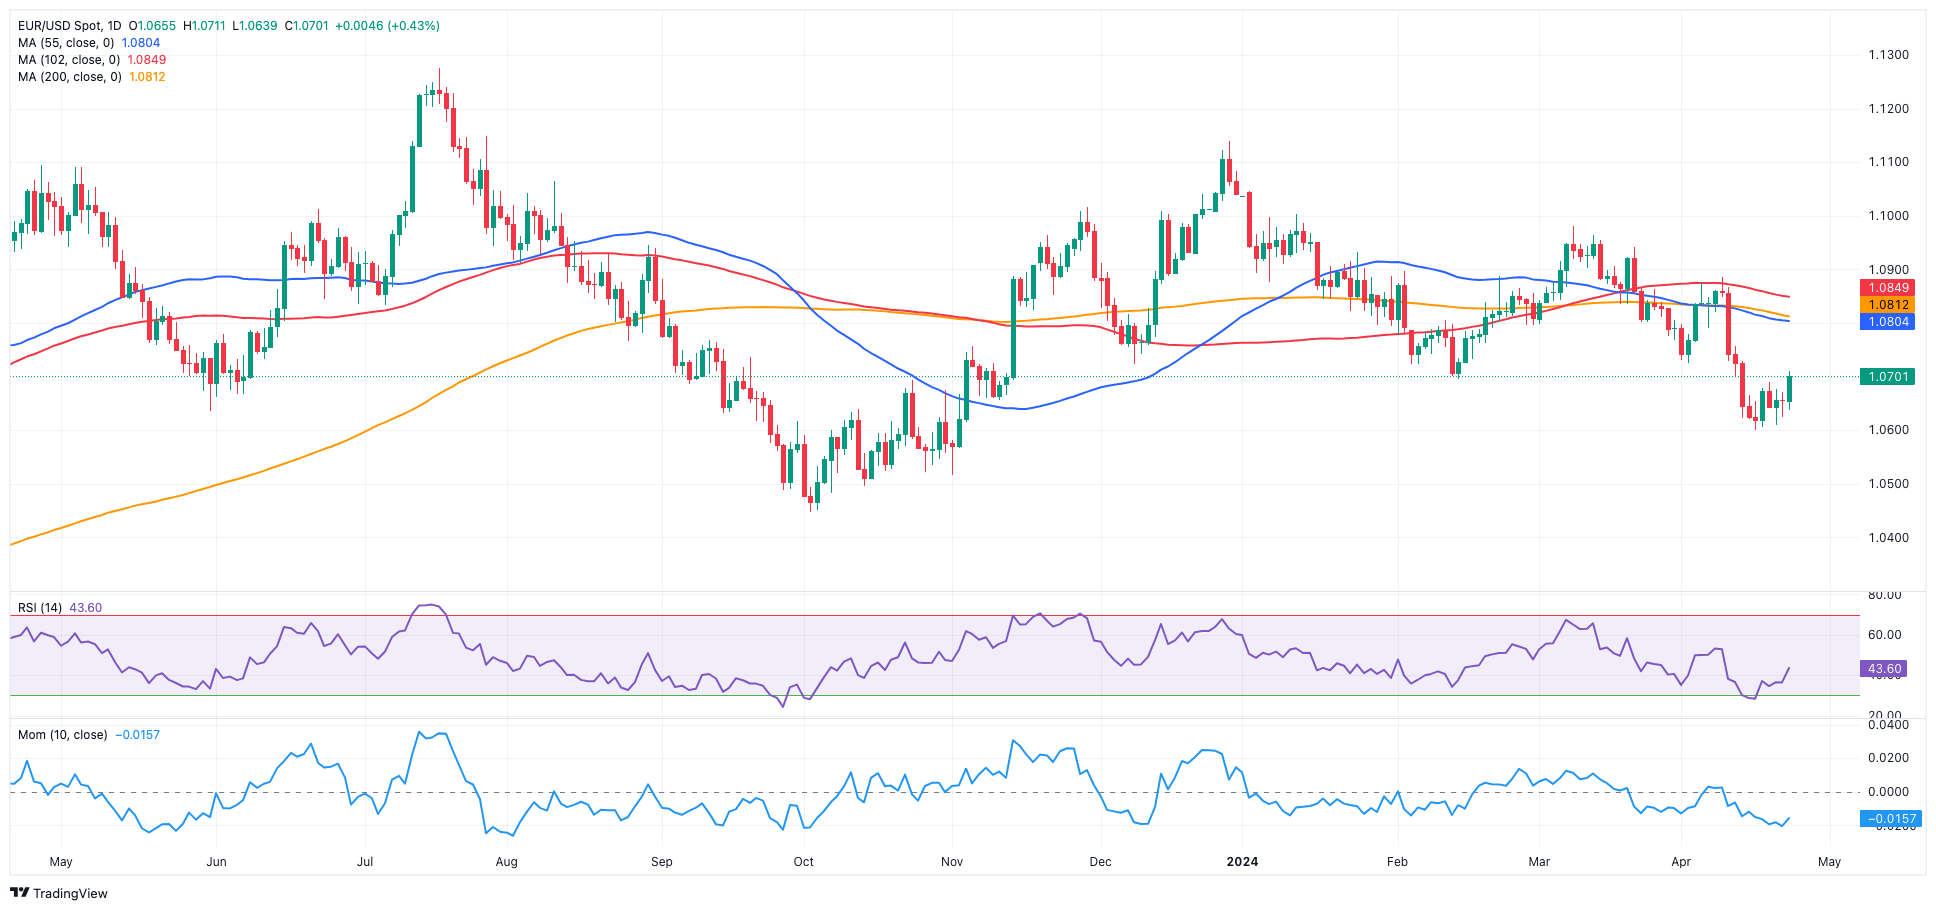
EUR/USD daily chart
 EUR/USD short-term technical outlook
On the upside, EUR/USD is expected to face initial resistance at the important 200-day SMA of 1.0811, followed by the April high of 1.0885 (April 9), the March top of 1.0981 (March 8), and the weekly peak of 1.0998 (January 11), all before reaching the psychological barrier of 1.1000.
The breach of the 2024 low of 1.0601 (April 16) could indicate a return to the November 2023 low of 1.0516 (November 1), which preceded the weekly low of 1.0495 (October 13, 2023). Once this region is passed, a visit to the 2023 bottom of 1.0448 (October 3) may begin to take shape before the round milestone of 1.0400.
The 4-hour chart shows that the bullish trend appears to have regained its momentum. The initial up-barrier is at 1.0711, prior to the 100-SMA of 1.0731 and then 1.0756. The initial support, in the meantime, is 1.0601, followed by 1.0516. The Relative Strength Index (RSI) rose above 65.
Author

Pablo Piovano
FXStreet
Born and bred in Argentina, Pablo has been carrying on with his passion for FX markets and trading since his first college years.
















