EUR/USD Forecast: Risk of a steeper decline once below 1.0950

EUR/USD Current price: 1.0976
- Upbeat United States macroeconomic data brought relief to financial markets.
- Resurgent risk appetite was not enough to underpin the Euro.
- EUR/USD at risk of falling further, but buyers did not give up.
The EUR/USD pair settled in the 1.0970 region on Thursday after losing the 1.1000 mark to upbeat United States (US) macroeconomic figures. The pair held within a tight range throughout the first half of the day but made a decisive bearish movement following the release of July Retail Sales, which unexpectedly increased by 1%, beating the 0.3% advance anticipated by market participants. Initial Jobless Claims for the week ended August 9 were up by 227K, better than the 235K expected.
The news brought relief and sent US indexes sharply up as investors decreased their bets on a potential recession in the country. Later in the day, the US released not-that-encouraging figures: Capacity Utilization hit 77.8% in July, while Industrial Production in the same month was down 0.6%, missing expectations. Nevertheless, stocks maintained positive momentum, while EUR/USD trimmed part of its early losses.
By the end of the day, investors kept believing the Federal Reserve (Fed) would deliver its first rate cut during the September meeting, although it is still unclear whether it would be 25 or 50 basis points (bps).
On Friday, the Eurozone will publish the June Trade Balance, while the US will release the preliminary estimate of the August Michigan Consumer Sentiment Index and the Michigan Consumer Inflation Expectations for the same month.
EUR/USD short-term technical outlook
From a technical point of view, the daily chart for the EUR/USD pair shows it could extend its slide. Technical indicators retreated from near overbought readings, maintaining their downward slopes within positive levels ahead of the Asian opening. At the same time, the pair develops above all its moving averages, with the 20 Simple Moving Average (SMA) heading north at around 1.0890. Finally, the 100 and 200 SMAs offer modest upward slopes far below the shorter one, limiting the odds for a sustained slide, particularly if the 1.0950 support level holds.
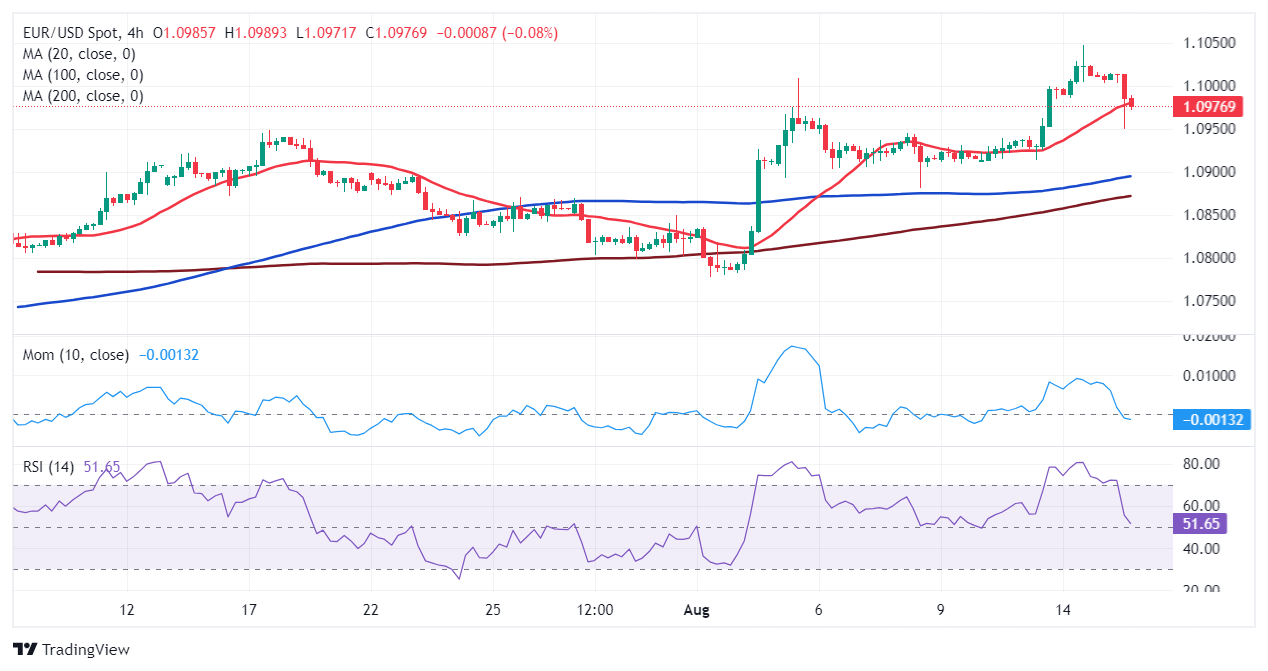
The pair is neutral-to-bullish according to technical readings in the 4-hour chart. Technical indicators lack directional strength within positive levels, while EUR/USD battles to recover above a bullish 20 SMA after piercing it earlier in the day. The longer moving averages grind north below the 1.0900 mark, suggesting buyers moved to the sidelines but not yet abandoned the pair.
Support levels: 1.0950 1.0900 1.0860
Resistance levels: 1.0970 1.1005 1.1045
Author

Valeria Bednarik
FXStreet
Valeria Bednarik was born and lives in Buenos Aires, Argentina. Her passion for math and numbers pushed her into studying economics in her younger years.


