EUR/USD Forecast: Next on the downside comes the 200-day SMA
- EUR/USD has extended its bearish performance so far this week.
- The Dollar appears well bid ahead of the release of the FOMC Minutes.
- Fed speakers remain cautious regarding potential rate cuts by the Fed.

EUR/USD extends its weakness for the third session in a row on Wednesday, this time hovering around the 1.0820 region in a context still favourable to the US Dollar (USD) and the risk-off mood.
Against that backdrop, the USD Index (DXY) manages to climb to multi-session peaks and flirt once again with the key 105.00 barrier.
The sour sentiment surrounding the European currency and the risk-linked galaxy in general was propped up by the higher-for-longer narrative around the G10 central banks, in turn bolstered by the upside surprise in UK inflation in April and the persevering prudent stance of Fed rate setters when it comes to the potential timing of the start of the Fed’s easing programme.
There has been no news from ECB’s President Christine Lagarde so far this week after she expressed on Tuesday strong confidence that eurozone inflation is under control as the impacts of the energy crisis and supply chain bottlenecks lessen.
Absent significant data releases on both sides of the ocean, market participants will closely follow the publication of the FOMC Minutes later on Wednesday, always with the timing of the potential interest rate cuts by the Fed taking centre stage.
EUR/USD short-term technical outlook
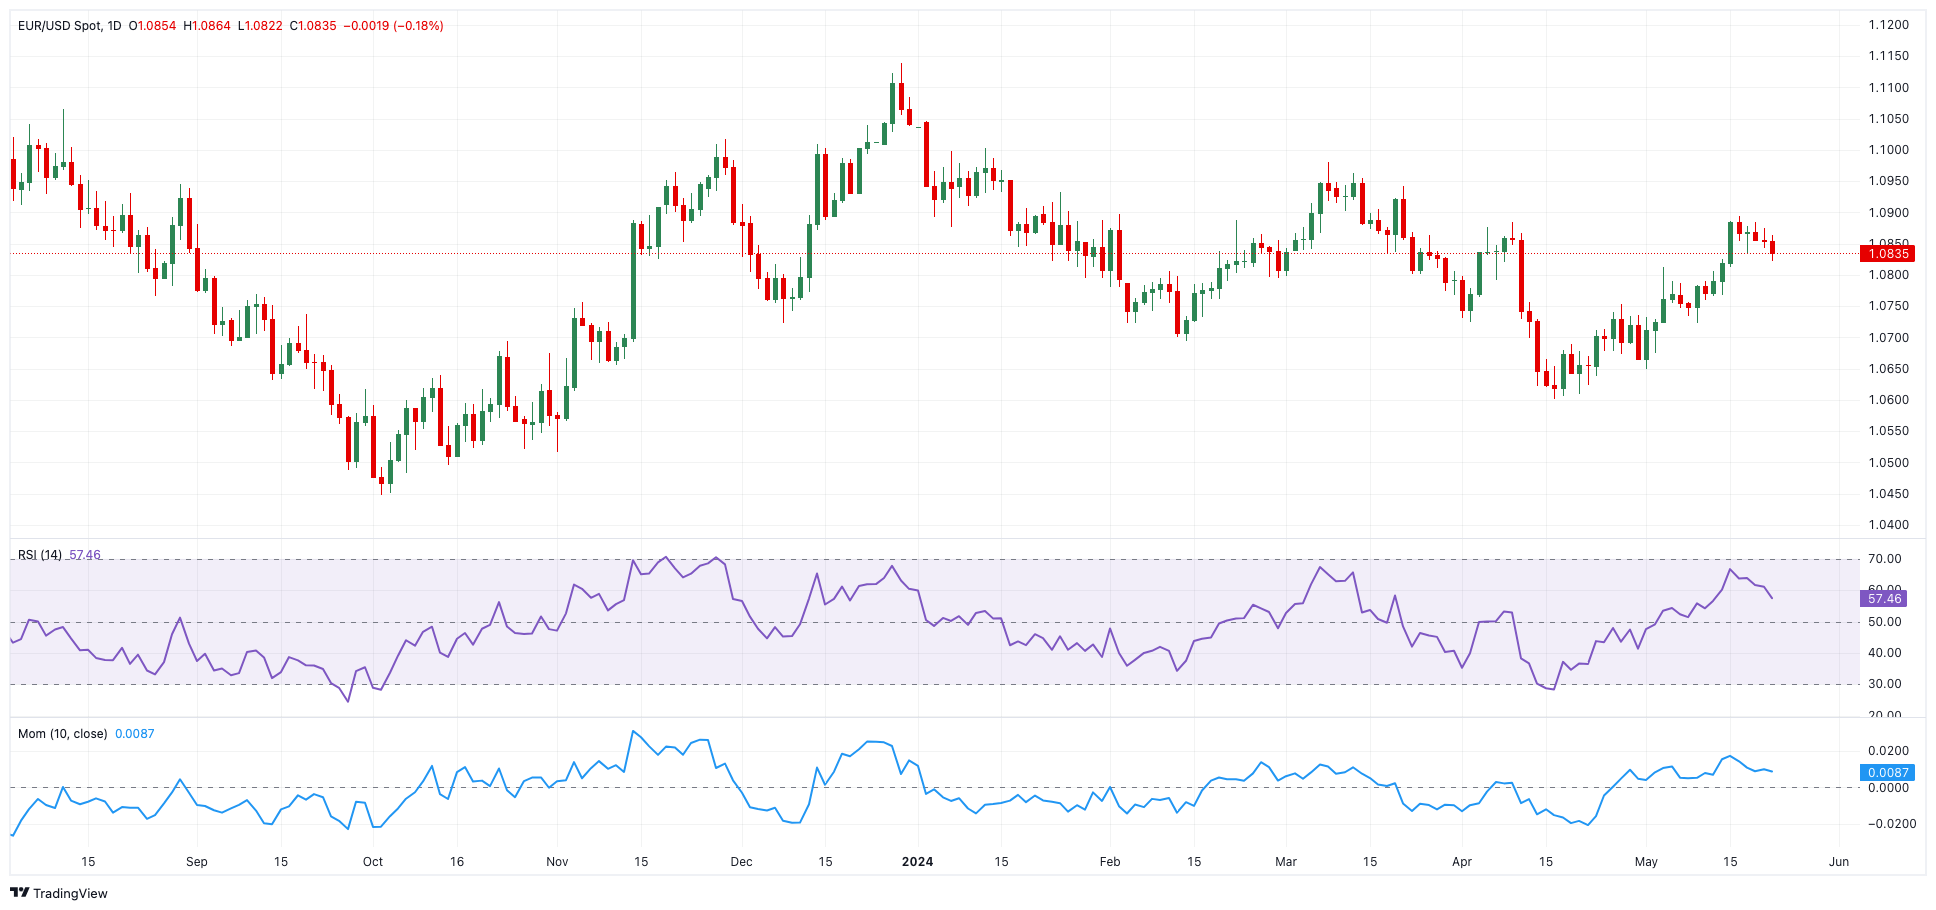
From a technical standpoint, EUR/USD’s daily chart shows the pair on a renewed downtrend, with the interim 55-day Simple Moving Average (SMA) approaching a flat 200-day SMA from above. Meanwhile, technical indicators continue to fall from their weekly highs, highlighting some acceleration of the downside impetus.
On the 4-hour scale, spot continues to retreat from recent peaks. That said, spot develops around its interim 55-SMA, which continues to point upwards. Finally, the Momentum indicator receded to around -30, along with the strong drop of the Relative Strength Index (RSI) indicator to the sub-40 region.
Support levels: 1.0820 1.0795 1.0750
Resistance levels: 1.0890 1.0920 1.0960
Premium
You have reached your limit of 3 free articles for this month.
Start your subscription and get access to all our original articles.
Author

Pablo Piovano
FXStreet
Born and bred in Argentina, Pablo has been carrying on with his passion for FX markets and trading since his first college years.


