EUR/USD Forecast: Euro stabilizes above 1.1100 as focus shifts to Fed
- EUR/USD moves sideways above 1.1100 in the European session.
- The Fed will announce monetary policy decisions later in the day.
- The pair faces a two-way risk amid uncertainty regarding the size of the Fed rate cut.

EUR/USD registered small losses on Tuesday as the US Dollar (USD) recovered modestly. The pair holds steady above 1.1100 early Wednesday as investors gear up for the Federal Reserve's (Fed) monetary policy announcements.
Euro PRICE This week
The table below shows the percentage change of Euro (EUR) against listed major currencies this week. Euro was the strongest against the Japanese Yen.
| USD | EUR | GBP | JPY | CAD | AUD | NZD | CHF | |
|---|---|---|---|---|---|---|---|---|
| USD | -0.49% | -0.63% | 0.69% | -0.06% | -1.10% | -0.91% | -0.44% | |
| EUR | 0.49% | -0.20% | 1.12% | 0.39% | -0.68% | -0.49% | 0.00% | |
| GBP | 0.63% | 0.20% | 1.25% | 0.59% | -0.48% | -0.27% | 0.22% | |
| JPY | -0.69% | -1.12% | -1.25% | -0.74% | -1.72% | -1.57% | -1.18% | |
| CAD | 0.06% | -0.39% | -0.59% | 0.74% | -1.13% | -0.86% | -0.49% | |
| AUD | 1.10% | 0.68% | 0.48% | 1.72% | 1.13% | 0.20% | 0.68% | |
| NZD | 0.91% | 0.49% | 0.27% | 1.57% | 0.86% | -0.20% | 0.49% | |
| CHF | 0.44% | -0.00% | -0.22% | 1.18% | 0.49% | -0.68% | -0.49% |
The heat map shows percentage changes of major currencies against each other. The base currency is picked from the left column, while the quote currency is picked from the top row. For example, if you pick the Euro from the left column and move along the horizontal line to the US Dollar, the percentage change displayed in the box will represent EUR (base)/USD (quote).
Slightly better-than-expected Retail Sales data from the US helped the USD hold its ground in the American session on Tuesday and didn't allow EUR/USD to build on Monday's gains.
Later in the day, the Fed is widely expected to lower the policy rate. However, the size of the rate cut is still up in the air. According to the CME FedWatch Tool, markets are currently pricing in a 61% probability of a 50 basis points (bps) rate cut and a 39% chance of a 25 bps cut.
The market positioning suggests that the USD faces a two-way risk heading into the event. A 50 bps cut could trigger a USD selloff with the immediate reaction and boost EUR/USD. On the other hand, the USD could gather strength and drag the pair lower if the Fed opts for a 25 bps rate reduction.
Investors will also pay close attention to the revised Summary of Economic Projections (SEP), the so-called dot-plot. In addition to the rate decision, the number of rate cut projections the dot-plot shows for the rest of the year could influence the USD's valuation.
If the Fed lowers the policy rate by 25 bps but the dot plot highlights a total of another 75 bps reduction in the remaining two policy meetings, the USD could have a difficult time outperforming its rivals. Following the Fed's policy announcements, Chairman Jerome Powell will respond to questions at a press conference starting at 1830 GMT.
EUR/USD Technical Analysis
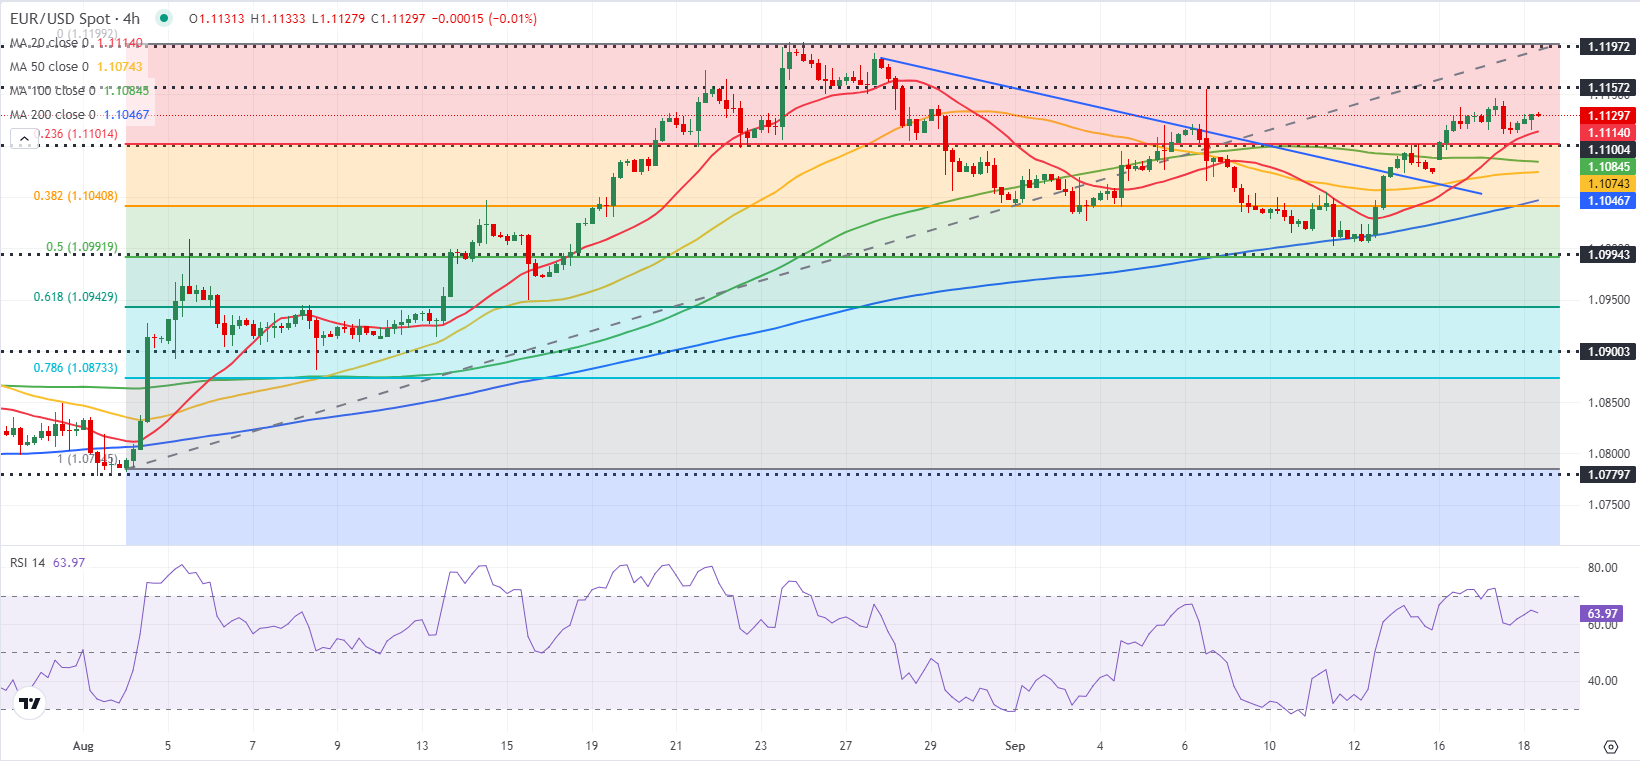
The near-term technical outlook points to a bullish bias, with the Relative Strength Index (RSI) indicator on the 4-hour chart holding above 60. On the upside, 1.1160 (static level) aligns as first resistance ahead of 1.1200 and 1.1275 (July 18, 2023, high).
Looking south, the Fibonacci 23.6% retracement level of the latest uptrend and the 100-period Simple Moving Average (SMA) form a strong support area at 1.1100-1.1085 ahead of 1.1040-1.1050 (Fibonacci 38.2% retracement, 200-period SMA).
Dot Plot FAQs
The “Dot Plot” is the popular name of the interest-rate projections by the Federal Open Market Committee (FOMC) of the US Federal Reserve (Fed), which implements monetary policy. These are published in the Summary of Economic Projections, a report in which FOMC members also release their individual projections on economic growth, the unemployment rate and inflation for the current year and the next few ones. The document consists of a chart plotting interest-rate projections, with each FOMC member’s forecast represented by a dot. The Fed also adds a table summarizing the range of forecasts and the median for each indicator. This makes it easier for market participants to see how policymakers expect the US economy to perform in the near, medium and long term.
The US Federal Reserve publishes the “Dot Plot” once every other meeting, or in four of the eight yearly scheduled meetings. The Summary of Economic Projections report is published along with the monetary policy decision.
The “Dot Plot” gives a comprehensive insight into the expectations from Federal Reserve (Fed) policymakers. As projections reflect each official’s projection for interest rates at the end of each year, it is considered a key forward-looking indicator. By looking at the “Dot Plot” and comparing the data to current interest-rate levels, market participants can see where policymakers expect rates to head to and the overall direction of monetary policy. As projections are released quarterly, the “Dot Plot” is widely used as a guide to figure out the terminal rate and the possible timing of a policy pivot.
The most market-moving data in the “Dot Plot” is the projection of the federal funds rate. Any change compared with previous projections is likely to influence the US Dollar (USD) valuation. Generally, if the “Dot Plot” shows that policymakers expect higher interest rates in the near term, this tends to be bullish for USD. Likewise, if projections point to lower rates ahead, the USD is likely to weaken.
Premium
You have reached your limit of 3 free articles for this month.
Start your subscription and get access to all our original articles.
Author

Eren Sengezer
FXStreet
As an economist at heart, Eren Sengezer specializes in the assessment of the short-term and long-term impacts of macroeconomic data, central bank policies and political developments on financial assets.


