EUR/USD Current price: 1.0744
- ECB member Mario Centeno delivered yet another hawkish message.
- The United States celebrates the Juneteenth holiday, local markets will remain closed.
- EUR/USD bullish in the near term, resistance at 1.0760, the weekly high.
The US Dollar is under mild selling pressure in a quiet Wednesday, helping EUR/USD advance towards the 1.0750 price zone. Stock markets trade mixed, confined to tight ranges around their opening levels, suggesting speculative interest lacks directional motivation.
The Euro found support in comments from European Central Bank (ECB) Governing Council member Mario Centeno. Centeno said that interest rates will be cut further if inflation slows, maintaining the hawkish bias set in the June ECB meeting.
Other than that, the Eurozone released the April Current Account, which posted a seasonally adjusted surplus of €38.6 billion, improving from the €35.8 billion posted in March and beating expectations. Construction Output in the same month contracted by 0.2%, better than the 0.5% loss from the previous month.
The United States (US) published MBA Mortgage Applications for the week ended June 14, which rose 0.9%. It is worth reminding that the country celebrates the Juneteenth holiday, and local markets will remain closed, limiting FX activity throughout the American afternoon.
EUR/USD short-term technical outlook
The EUR/USD pair is up for a third consecutive day, although gains are modest. EUR/USD posted a weekly high at 1.0760 on Tuesday, the level to surpass to gain additional upward traction. Technically, however, the risk skews to the downside. The daily chart shows EUR/USD develops far below all its moving averages, with the 20 Simple Moving Average (SMA) heading modestly lower above flat 100 and 200 SMAs. The Momentum indicator aims marginally lower below its 100 level, while the Relative Strength Index (RSI) indicator consolidates at around 44, suggesting buyers remain sidelined.
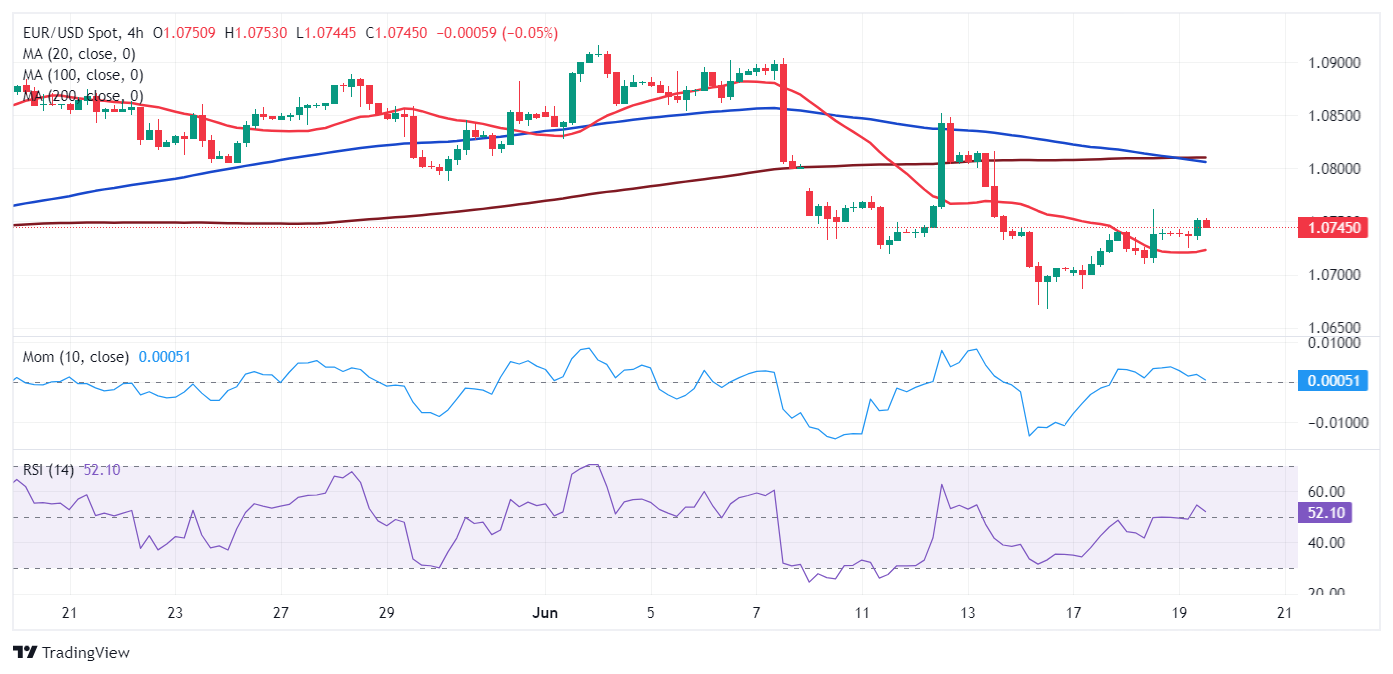
According to the 4-hour chart, near-term advances seem likely. The EUR/USD pair is finding support around a now flat 20 SMA, although the 100 SMA crosses below the 200 SMA, limiting the upside in the 1.0810 price zone. Finally, technical indicators extend their advances above their midlines, in line with the latest bounce, although not enough to confirm a steady advance ahead.
Support levels: 1.0710 1.0665 1.0620
Resistance levels: 1.0760 1.0810 1.0840
Information on these pages contains forward-looking statements that involve risks and uncertainties. Markets and instruments profiled on this page are for informational purposes only and should not in any way come across as a recommendation to buy or sell in these assets. You should do your own thorough research before making any investment decisions. FXStreet does not in any way guarantee that this information is free from mistakes, errors, or material misstatements. It also does not guarantee that this information is of a timely nature. Investing in Open Markets involves a great deal of risk, including the loss of all or a portion of your investment, as well as emotional distress. All risks, losses and costs associated with investing, including total loss of principal, are your responsibility. The views and opinions expressed in this article are those of the authors and do not necessarily reflect the official policy or position of FXStreet nor its advertisers. The author will not be held responsible for information that is found at the end of links posted on this page.
If not otherwise explicitly mentioned in the body of the article, at the time of writing, the author has no position in any stock mentioned in this article and no business relationship with any company mentioned. The author has not received compensation for writing this article, other than from FXStreet.
FXStreet and the author do not provide personalized recommendations. The author makes no representations as to the accuracy, completeness, or suitability of this information. FXStreet and the author will not be liable for any errors, omissions or any losses, injuries or damages arising from this information and its display or use. Errors and omissions excepted.
The author and FXStreet are not registered investment advisors and nothing in this article is intended to be investment advice.
Recommended Content
Editors’ Picks

EUR/USD accelerates losses to 1.0930 on stronger Dollar
The US Dollar's recovery regains extra impulse sending the US Dollar Index to fresh highs and relegating EUR/USD to navigate the area of daily troughs around 1.0930 in the latter part of Friday's session.

GBP/USD plummets to four-week lows near 1.2850
The US Dollar's rebound keep gathering steam and now sends GBP/USD to the area of multi-week lows in the 1.2850 region amid the broad-based pullback in the risk-associated universe.

Gold trades on the back foot, flirts with $3,000
Gold prices are accelerating their daily decline, steadily approaching the critical $3,000 per troy ounce mark as the Greenback's rebound gains extra momentum and US yields tighten their retracement.

Can Maker break $1,450 hurdle as whales launch buying spree?
Maker holds steadily above $1,250 support as a whale scoops $1.21 million worth of MKR. Addresses with a 100k to 1 million MKR balance now account for 24.27% of Maker’s total supply. Maker battles a bear flag pattern as bulls gather for an epic weekend move.

Strategic implications of “Liberation Day”
Liberation Day in the United States came with extremely protectionist and inward-looking tariff policy aimed at just about all U.S. trading partners. In this report, we outline some of the more strategic implications of Liberation Day and developments we will be paying close attention to going forward.

The Best brokers to trade EUR/USD
SPONSORED Discover the top brokers for trading EUR/USD in 2025. Our list features brokers with competitive spreads, fast execution, and powerful platforms. Whether you're a beginner or an expert, find the right partner to navigate the dynamic Forex market.