EUR/USD Forecast: Bears add pressure, 1.0660 at sight

EUR/USD Current price: 1.0713
- Federal Reserve Governor Michelle Bowman delivered hawkish comments that boosted the USD.
- The United States will soon release the CB Consumer Confidence index for June.
- EUR/USD gains downward traction, could pierce the 1.0700 threshold.
The EUR/USD pair is under mild selling pressure ahead of Wall Street’s opening after meeting buyers ahead of 1.0750 for a second consecutive day. The US Dollar benefits from a souring mood, with European indexes extending their Monday slides and US futures trimming early gains.
The latest bout of USD demand came after comments from Federal Reserve (Fed) Governor Michelle Bowman. Her words were quite hawkish, as she said the Fed is not yet at the point where it is appropriate to cut rates. Even further, Bowman expressed willingness to raise rates if inflation progress stalls. Finally, she added that the labor market remains tight and sees only modest progress on inflation this year.
The United States (US) will publish the May Chicago Fed National Activity Index, the April S&P/Case-Shiller Hope Price Indexes report, the June Richmond Fed Manufacturing Index and CB Consumer Confidence for the same month.
EUR/USD short-term technical outlook
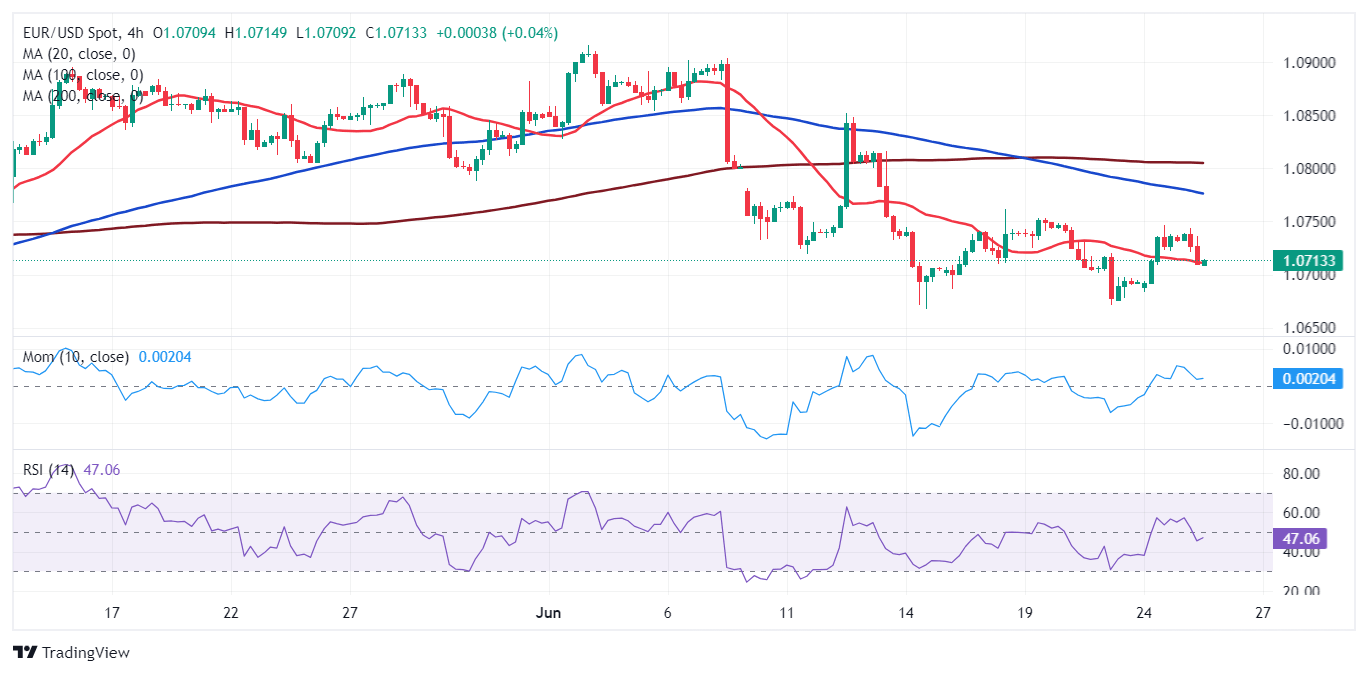
The EUR/USD pair is confined to a 100-pip range for a second consecutive week, with the risk increasingly leaning to the downside. The pair barely holds above the 1.0710 support, while the daily chart shows it is developing below all its moving averages. Furthermore, the 20 Simple Moving Average (SMA) maintains its bearish slope, crossing below directionless and converging 100 and 200 SMAs. At the same time, technical indicators resumed their slides within negative levels, although the bearish strength remains limited.
The 4-hour chart shows near-term sellers are gaining confidence. EUR/USD is currently pressuring from above a bearish 20 SMA, while the longer ones gain downward traction far above the current level. Finally, technical indicators turned firmly south, with the Relative Strength Index (RSI) indicator currently at 46, in line with another leg south. The base of the range is at the 1.0660 price zone, the next relevant support area, and a potential bearish target should demand for the USD persist.
Support levels: 1.0710 1.0665 1.0620
Resistance levels: 1.0760 1.0810 1.0840
Premium
You have reached your limit of 3 free articles for this month.
Start your subscription and get access to all our original articles.
Author

Valeria Bednarik
FXStreet
Valeria Bednarik was born and lives in Buenos Aires, Argentina. Her passion for math and numbers pushed her into studying economics in her younger years.


