EUR/USD Current Price: 1.0289
- Growth across the EU slowed to a 16-month low in June, according to S&P Global.
- Wall Street plummets ahead of the opening amid lingering recession fears.
- EUR/USD trades at its lowest in 20 years and heads towards parity.
The EUR/USD pair fell to 1.0279, its lowest since December 2002. The American dollar ran as stocks plunged, reflecting market concerns. S&P Global released the final versions of the EU June PMIs, which showed that growth across the EU slowed to a 16-month low. Services activity increased at a weaker rate, whilst goods production fell for the first time in two years. The data exacerbated recession fears, while inflation in the Union stands at record highs.
Meanwhile, German Economy Minister Robert Habeck noted that the energy industry crisis could have a domino effect on the market. He did not rule out intervening gas prices. Since Russia curbed its gas flows to the country, Germany fears a complete blackout of Moscow’s provision, as Russia will temporarily shut down the Nord Stream-1 pipeline on July 11 for annual maintenance.
Ahead of the US opening, Wall Street futures are sharply down, dragged by substantial losses in its overseas counterparts. Government bond yields, on the other hand, ease as investors rush to safety. The yield on the 10-year Treasury note is currently hovering at around 2.85%.
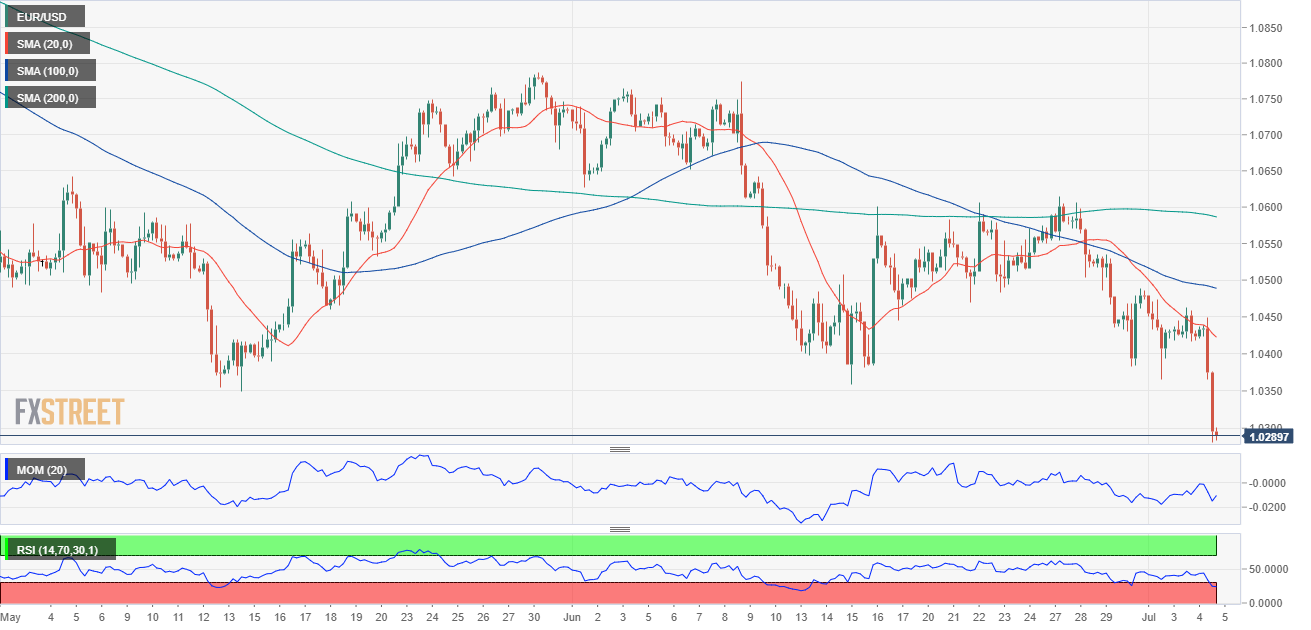
EUR/USD short-term technical outlook
The EUR/USD pair trades below the 1.0300 threshold and the bearish breakout of the 1.0330/40 support area anticipates further declines ahead, with parity now in sight. Technically, the daily chart reflects strong selling interest, as the pair holds near the mentioned low while far below all of its moving averages. Technical indicators, in the meantime, accelerated south, maintaining their firmly bearish slopes within negative levels.
The 4-hour chart shows that technical indicators remain at daily lows, partially losing their bearish momentum. The RSI keeps heading south, despite being at 26, hinting at a current pause ahead of another leg south. Furthermore, the pair collapsed after repeatedly failing to overcome a bearish 20 SMA, another hint for a bearish continuation.
Support levels: 1.0260 1.0215 1.0170
Resistance levels: 1.0335 1.0380 1.0425
Information on these pages contains forward-looking statements that involve risks and uncertainties. Markets and instruments profiled on this page are for informational purposes only and should not in any way come across as a recommendation to buy or sell in these assets. You should do your own thorough research before making any investment decisions. FXStreet does not in any way guarantee that this information is free from mistakes, errors, or material misstatements. It also does not guarantee that this information is of a timely nature. Investing in Open Markets involves a great deal of risk, including the loss of all or a portion of your investment, as well as emotional distress. All risks, losses and costs associated with investing, including total loss of principal, are your responsibility. The views and opinions expressed in this article are those of the authors and do not necessarily reflect the official policy or position of FXStreet nor its advertisers. The author will not be held responsible for information that is found at the end of links posted on this page.
If not otherwise explicitly mentioned in the body of the article, at the time of writing, the author has no position in any stock mentioned in this article and no business relationship with any company mentioned. The author has not received compensation for writing this article, other than from FXStreet.
FXStreet and the author do not provide personalized recommendations. The author makes no representations as to the accuracy, completeness, or suitability of this information. FXStreet and the author will not be liable for any errors, omissions or any losses, injuries or damages arising from this information and its display or use. Errors and omissions excepted.
The author and FXStreet are not registered investment advisors and nothing in this article is intended to be investment advice.
Recommended Content
Editors’ Picks
EUR/USD trades with negative bias, holds above 1.0700 as traders await US PCE Price Index

EUR/USD edges lower during the Asian session on Friday and moves away from a two-week high, around the 1.0740 area touched the previous day. Spot prices trade around the 1.0725-1.0720 region and remain at the mercy of the US Dollar price dynamics ahead of the crucial US data.
USD/JPY jumps above 156.00 on BoJ's steady policy

USD/JPY has come under intense buying pressure, surging past 156.00 after the Bank of Japan kept the key rate unchanged but tweaked its policy statement. The BoJ maintained its fiscal year 2024 and 2025 core inflation forecasts, disappointing the Japanese Yen buyers.
Gold price flatlines as traders look to US PCE Price Index for some meaningful impetus

Gold price lacks any firm intraday direction and is influenced by a combination of diverging forces. The weaker US GDP print and a rise in US inflation benefit the metal amid subdued USD demand. Hawkish Fed expectations cap the upside as traders await the release of the US PCE Price Index.
Sei Price Prediction: SEI is in the zone of interest after a 10% leap

Sei price has been in recovery mode for almost ten days now, following a fall of almost 65% beginning in mid-March. While the SEI bulls continue to show strength, the uptrend could prove premature as massive bearish sentiment hovers above the altcoin’s price.
US core PCE inflation set to signal firm price pressures as markets delay Federal Reserve rate cut bets

The core PCE Price Index, which excludes volatile food and energy prices, is seen as the more influential measure of inflation in terms of Fed positioning. The index is forecast to rise 0.3% on a monthly basis in March, matching February’s increase.