EUR/GBP: Waiting for the bullish correction on the EUR/GBP to be exhausted

The remarkable, bullish run of the euro is temporarily suspended, with a possibility for a complete trend reversal. The EUR/GBP pair has been falling since the 28th of July, and the price action is currently concentrated below a major Fibonacci retracement level, which begs the question if a bigger dropdown is possible to develop at the present rate.
There are no significant economic releases in the Eurozone scheduled for this week, which is why the euro remains somewhat subdued. Meanwhile, more volatility can be anticipated to affect the value of the pound.
Earlier today, the Office for National Statistics in the UK published its findings regarding the quarterly GDP growth rate. The data revealed that the British economy has contracted by the massive 20.4 per cent in the three months leading to June, which is the biggest slump on record. Despite these detrimental figures, the pound did not register a significant dropdown following the publication, which means that the market has already started to price in the impact of the economic fallout well in advance.
The EUR/GBP is currently developing a minor bullish correction, but as it is about to be seen, the prevailing market sentiment looks tilted to the downside. This scenario is favourable for the implementation of swing trading strategies, as traders can wait for the establishment of a new swing high before placing short orders on the expectation for a continued falling of the price action.
Long-Term Outlook:
The daily chart below demonstrates the rapidly rising selling pressure in the market. As can be seen, the price action has established two consecutively lower peaks, which is evocative of a trend reversal illustrated by the descending trend line.
The price action is currently concentrated around the 38.2 per cent Fibonacci retracement level at 0.90340, which is adopting a new role as resistance. Due to this fact, a lot of fluctuations can be anticipated to occur while the price action remains concentrated within the consolidation area in blue. While there, the price action could jump up and down near the aforementioned resistance.
Such seemingly erratic fluctuations could serve as a transitionary stage before the market resumes trending. Similar behaviour was already observed before the creation of the latest bullish trend, as demonstrated by the consolidation area in green. The price action could, therefore, continue fluctuating around the 38.2 per cent Fibonacci retracement level over the next following days. However, if it manages to break down below the consolidation range, then the next target for a newly emerging downtrend would be encapsulated by the 61.8 per cent Fibonacci retracement level at 0.87498.
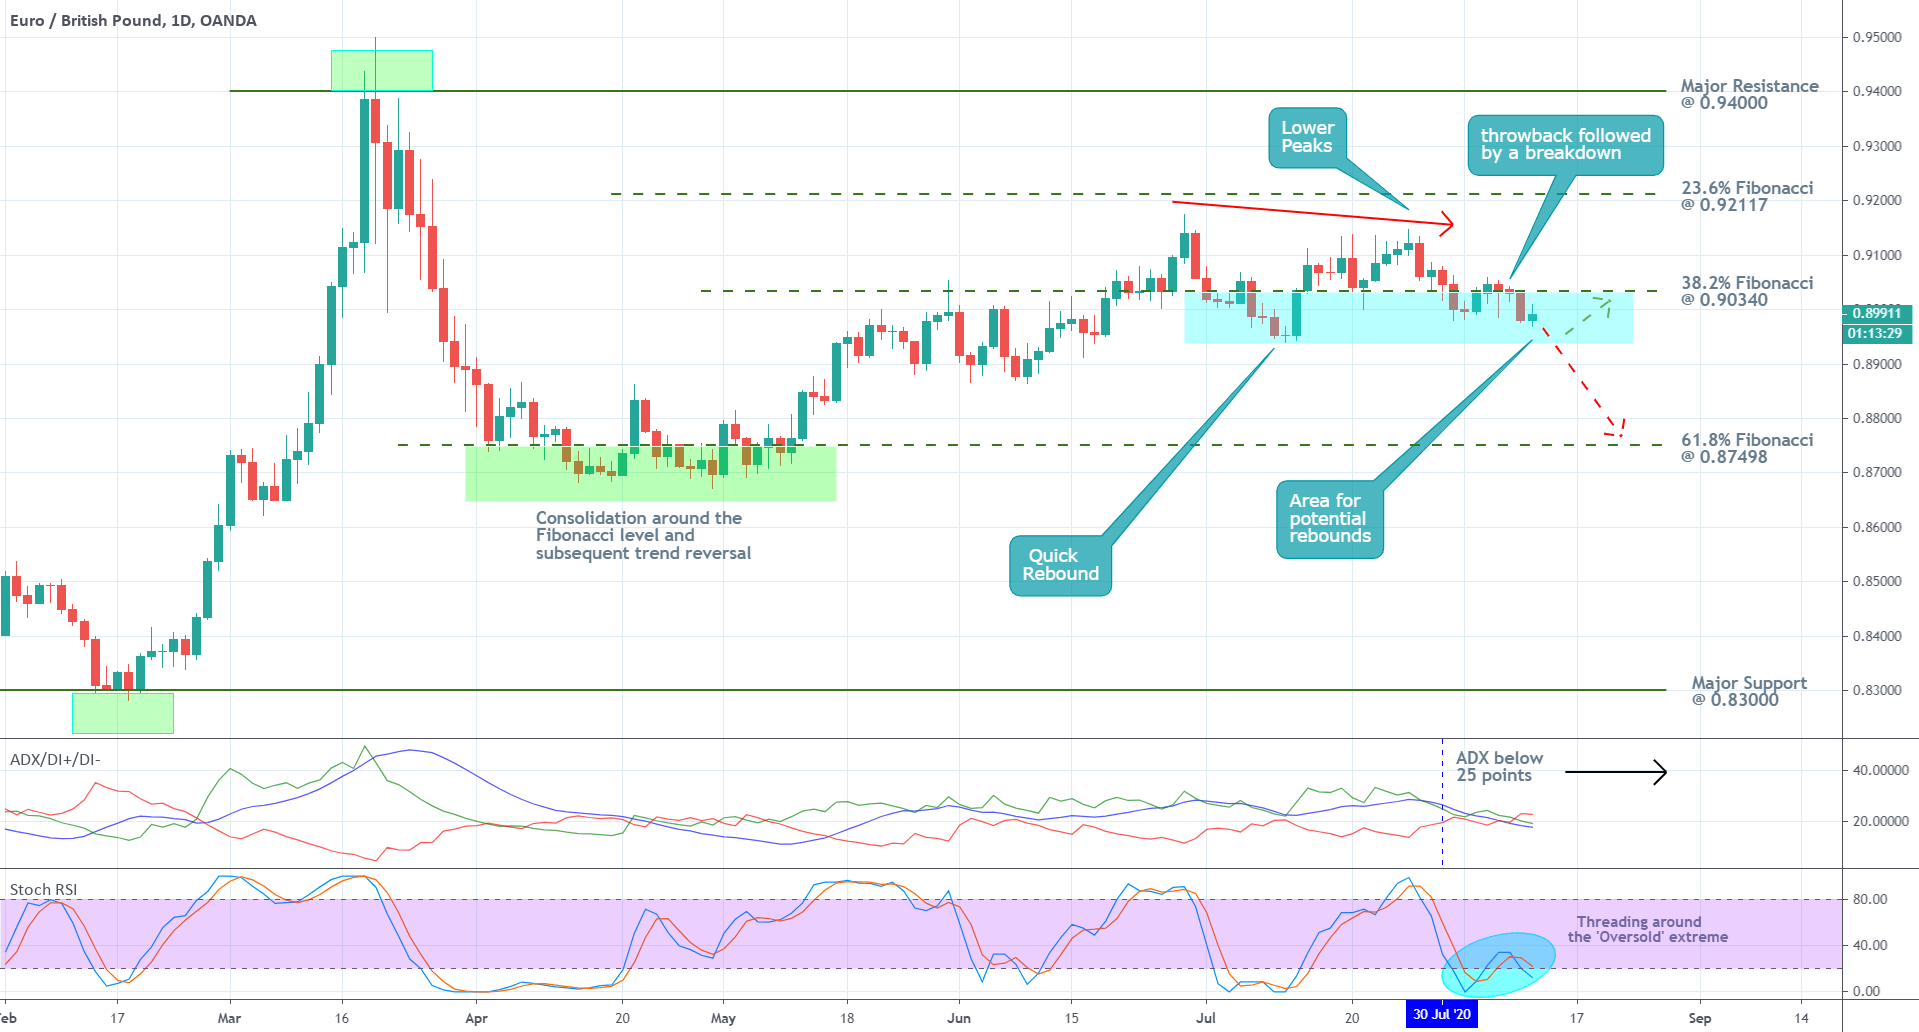
The ADX indicator has been threading below the 25-point benchmark since the 30th of July. While this entails the existence of range-trading conditions on the market, this outlook has not been prevailing for a long time. This means that the price action is not concentrated within a solid range, which allows for the establishment of a new trend in the near future.
Meanwhile, the Stochastic RSI indicator is threading close to its 'Oversold' extreme, which is a manifestation of robust selling pressure at present. Nevertheless, under the aforementioned range-trading conditions, this could prompt heightened buying pressure in the immediate future. This could explain the existence of the recent bullish correction, and could probably drive the price action towards the 38.2 per cent Fibonacci before the EUR/GBP can resume falling.
Short-Term Outlook:
As can be seen on the 4H chart below, the recent price action has been falling within the boundaries of a downwards sloping channel. The Keltner Channels indicator is used to illustrate the progression of the dropdown, which was commenced the last time the price action reached and subsequently rebounded from the channel's upper limit.
The latter serves as a floating resistance, and after the rebound itself, the price action established an impulse leg, which was concluded after the price action reached the channel's lower limit at point 1. This impulse leg can be perceived as the initial stage in the development of a broader 1-5 impulse wave pattern, as postulated by the Elliott Wave Theory.
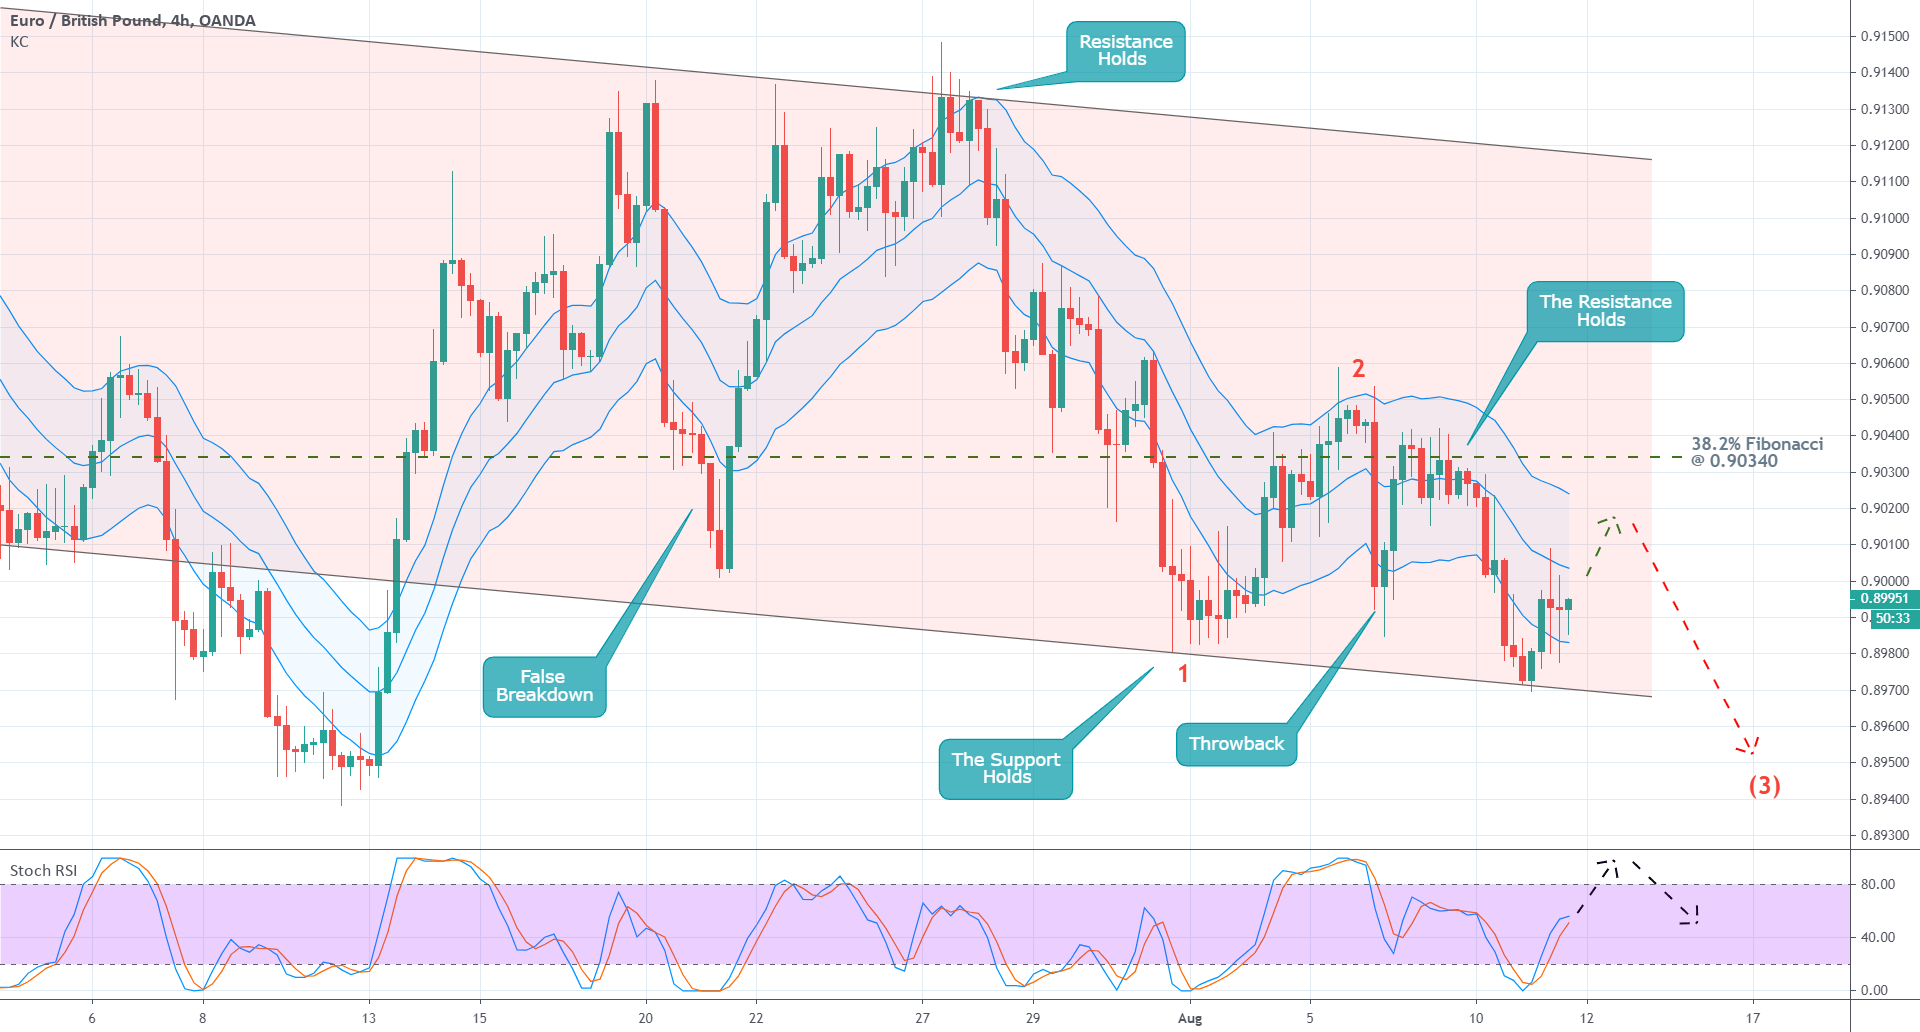
The subsequent correction represents the following (1-2) retracement leg, which attempted to but failed to drive the price action above the 38.2 per cent Fibonacci for a long time.
Finally, after the minor bullish correction is finalised, and a new swing high is established, the price action would be ready to resume heading south, and thereby develop the next impulse leg (2-3). The creation of such a swing high – the peak of the current bullish correction – can be affirmed once the Stochastic RSI indicator reaches the 'Overbought' extreme, and the underlying bullish pressure starts to diminish.
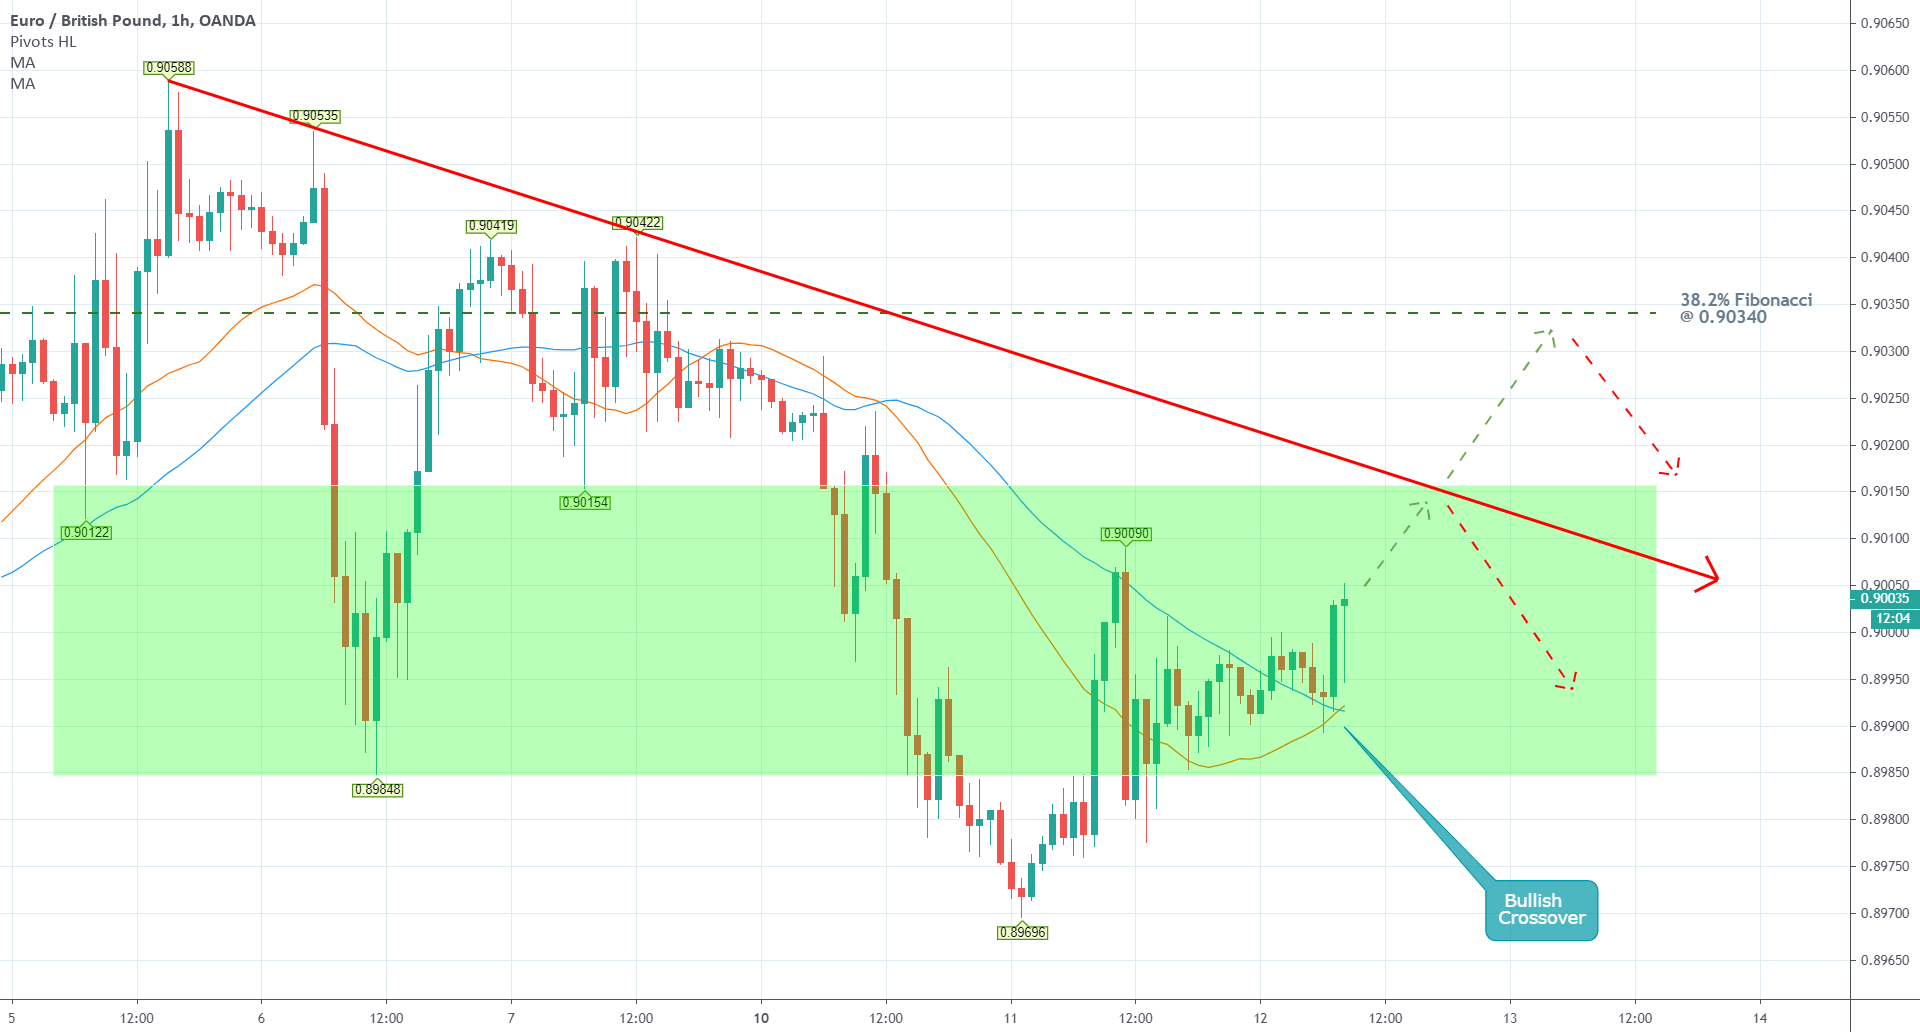
As can be seen on the hourly chart below, the 30-day MA (in orange) is about to cross above the 50-day MA (in blue), which underlines the rising bullish bias in the short-term. The correction could rise to the descending trend line, which converges towards the consolidation area in green's upper edge before it changes directions. Alternatively, if the bullish commitment continues to rise, the price action could test the resistance at 0.90340 before it rebounds and heads south.
Concluding Remarks:
The bears should not rush to place short orders right away. Even though the longer-term outlook is mostly bearish, the short-term bullish pressure looks strong enough to continue driving the price action higher. They should instead wait for definitive signs that the minor correction is concluded and that the price action is ready to resume falling.
For the time being, the EUR/GBP pair remains concentrated in a tight range around the 38.2 per cent Fibonacci retracement, which means that there is a high probability for erratic fluctuations around the two boundaries. Trending conditions can resume only after the price action manages to break out above or below the range's limits.
Author

Plamen Stoyanov
Trendsharks
Plamen started his career on the global capital markets in 2012 when he began trading with financial derivatives.


