Equity market chart book
The current drawdown might exceed 20% peak to trough on the S&P 500, but I do not expect a deep and prolonged bear market like that of the early 2000s or Global Financial Crisis.
As I said last month, the last all-time high in the S&P (on Jan 3rd) looks inconsistent with past major market tops across several frameworks: lack of yield curve inversion, bond yields relative to earnings yields, market performance, margin debt build-up, market breadth, uncertainty, private sector balance, etc. The secular bull market that started from the 2009 generational low is probably not over.
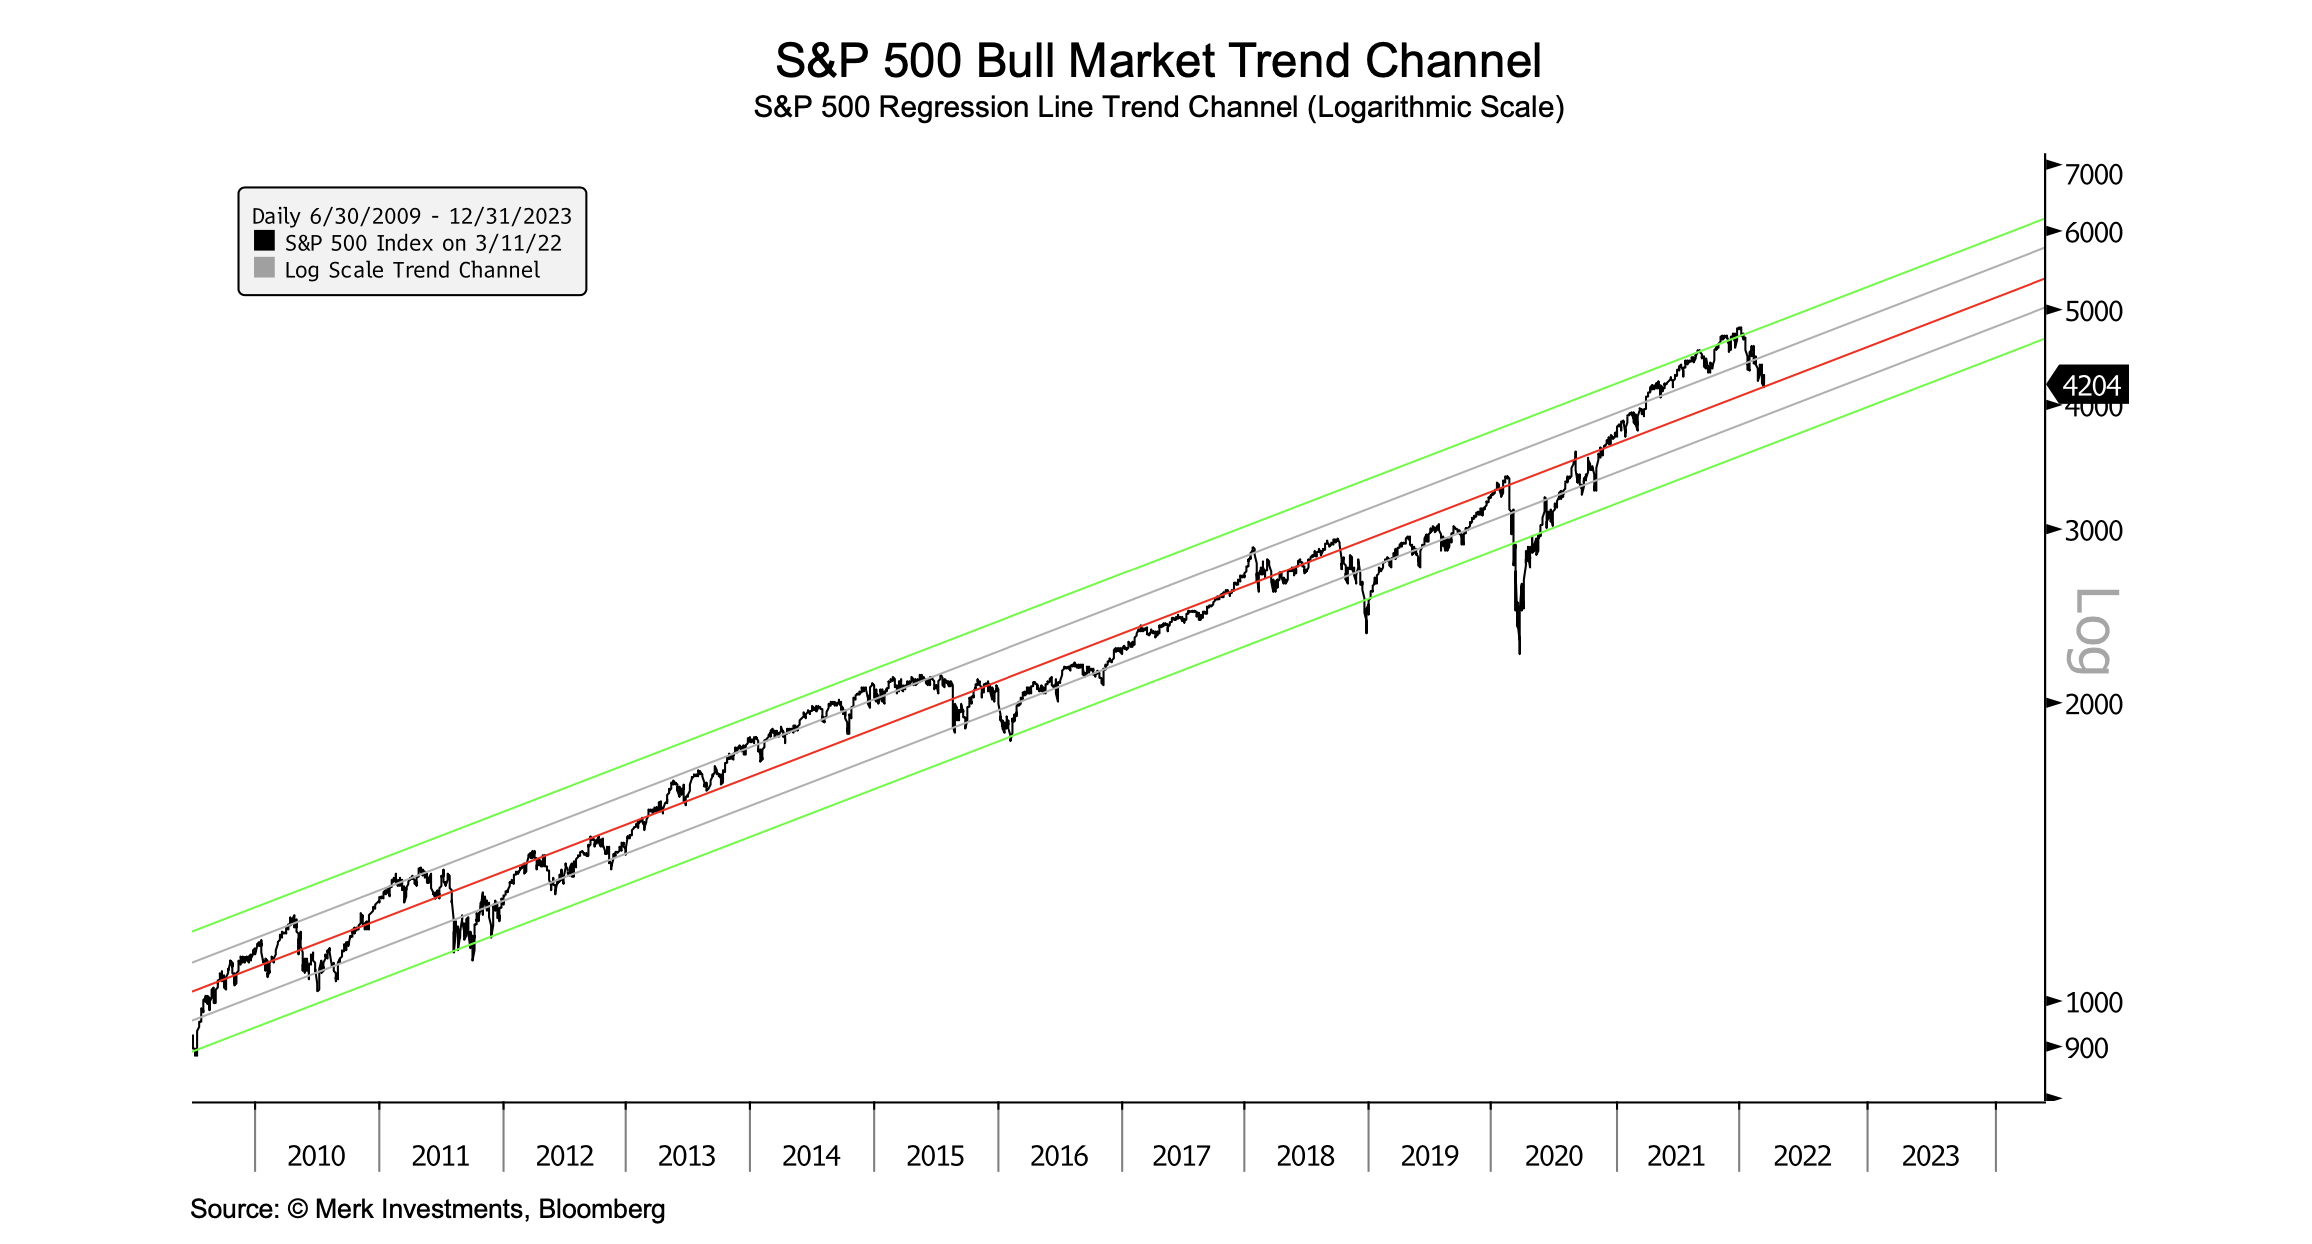
The S&P 500 is back to the middle of its log scale trend channel. The bottom end of the channel is around 3750, which would be a 22% decline from the all-time closing high of 4797 on Jan 3rd. That kind of decline is roughly consistent with the following historical analogs: 1990 (Iraq/Kuwait oil price spike/US recession), 1998 (Russian default/Asian financial crisis), 2011 (Eurozone recession/debt crisis), and 2018 (Fed QT + growth scare). It's also worth noting, even given the differences, that the market traded higher through the 1962 Cuban Missile Crisis with only a shallow drawdown along the way.
On Monday, the 50-day moving average crossed below the 200-day moving average on the S&P, creating the ominous-sounding "death cross" signal - a popular trend-following indicator among technical analysts.
Despite its name, the death-cross has been a contrarian signal outside of the aforementioned major bear markets (13 out of the last 15 times). Excluding the early 2000s and GFC, the signal has produced positive returns over the following year, with an average gain of 19% (13 examples going back to 1990): Here are the 1-year returns following the signal for the relevant analogs: 1990= +21%, 1998= +22%, 2011= +19%, 2018= +18%. In contrast, the early 2000s and GFC death-cross examples produced subsequent 1-year returns of -24% and -39%, respectively. But I don't think we're in that type of environment for reasons already stated.
Encouragingly, the oil price has come down sharply in recent days. From the peak last week, oil futures are down about 30% and back below $100 a barrel as of writing. The Fed will likely proceed with an initial rate hike but indicate heightened uncertainty and data dependency going forward.
As always - and particularly right now - the outlook requires constant reassessment. And everyone needs to put probability and reward-to-risk assessments in the context of their strategy, process, and time horizon.
Author

Axel Merk
Merk Hard Currency Fund
Axel Merk is the Founder and President of Merk Investments. Merk is an expert on macro trends, hard money, international investing and on building sustainable wealth.


