Dollar rally unwinds amid further signs of hope for China trade agreement

Market Overview
There has been a shift to a far more positive risk appetite in the first few sessions this week. The driving force has come from two “maybe” factors out of the US which have collectively given sentiment a real boost. Firstly the prospect of a tentative agreement between the Democrats and Republicans over Government funding. Whilst President Trump does not appear to be entirely happy with the details (especially over funding for his wall), if he agrees to this, it will mean that the US will avoid another costly Government shutdown. However, what has really boosted markets overnight has been further signs of positivity over the US/China trade dispute. President Trump has suggested that if enough progress was being made, that he could let the 1st March deadline “slide for a little while” in order to get to an agreement. By suggesting this, it means that there is cause for optimism. The impact has been fairly standard risk positive. Bond yields higher, yen underperformance, dollar slipping back, commodities and equities gaining ground. The Chinese yuan is also strengthening in a sign of improved sentiment across Emerging Asia with the news. What is also interesting is the move back into the euro which has dragged EUR/USD back above the crucial $1.1300 level. This was also good timing for the strength of the Kiwi, with the Reserve Bank of New Zealand holding rates but also maintaining a fairly neutral stance (no change was expected at +1.75%). The market had feared a more dovish shift and as such the Kiwi has jumped +1.5%.

Wall Street climbed decisively into the close with the S&P 500 +1.3% and US futures a further +0.4% today. This has helped a decisively positive Asian session with the Nikkei +1.3% and Shanghai Composite +1.9%. In Europe the outlook is also positive (albeit a little more constrained) with FTSE futures and DAX futures around half a percent higher. In forex, the move out of risk and out of the dollar continues, with the yen the big underperformer, whilst the dollar is sliding across the majors. The Kiwi is the big outperformer. In commodities, with the dollar weaker, silver and gold are holding support, whilst oil is also another percent higher as the rebound of the past couple of sessions continues.
It is all about inflation on the economic calendar today. UK inflation for January is at 0930GMT with headline UK CPI expected to fall to +1.9% (from +2.1% in December) which would be below the Bank of England’s 2% target for the first time in two years. Core UK CPI is expected to remain at +1.9% (+1.9% in December). US inflation for January is also today, at 1330GMT with headline US CPI expected to fall sharply to +1.5% (from +1.9% in December) with core US CPI expected to tick back to +2.1% from (+2.2% in December). EIA Oil inventories are at 1530GMT and are expected to show crude stocks +2.8m barrles (+1.3m barrels last week) with distillates -1.0m (-2.3m last week) and gasoline stocks +1.4m (+0.5m last week). Late in the session Japan Prelim GDP for Q4 is announced at 2350GMT which is expected to show +0.4% (-0.6% final in Q3).
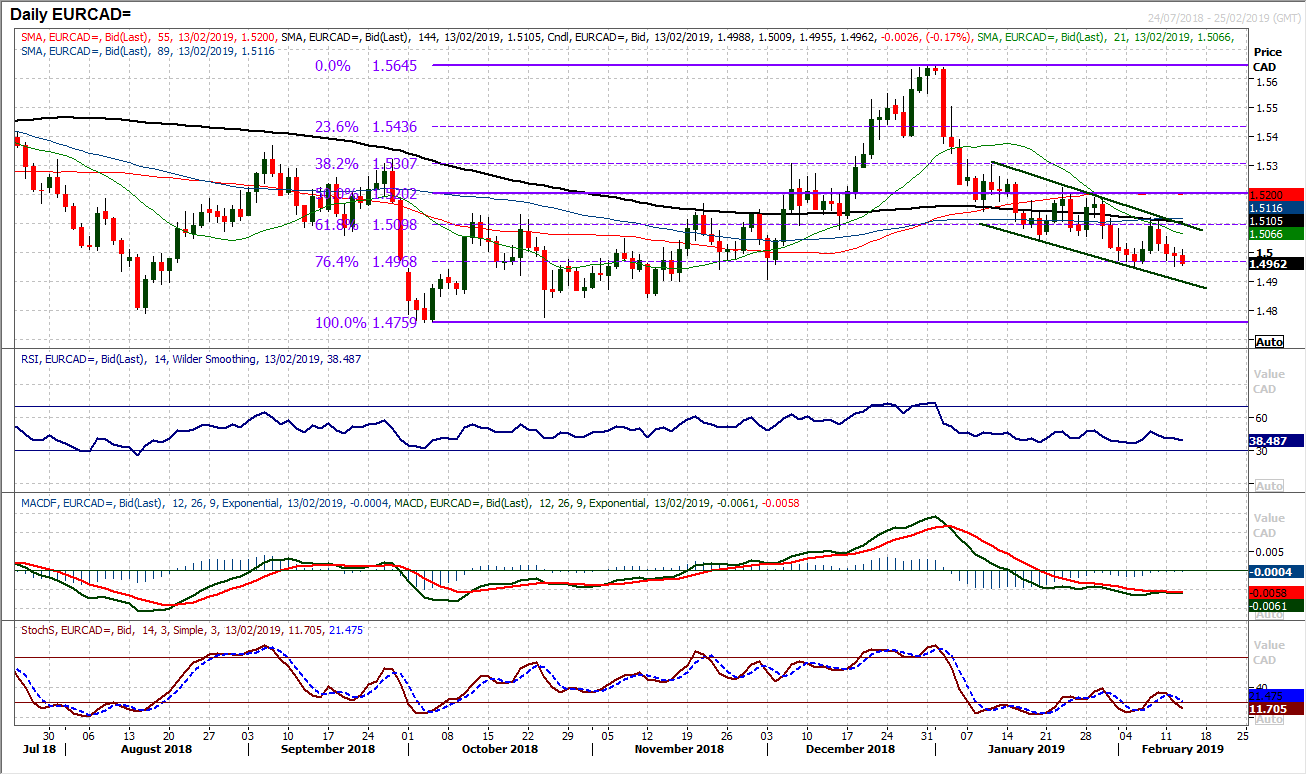
Chart of the Day – EUR/CAD
The Canadian dollar has held up relatively well on performance whilst the euro has been under pressure. This is a drag on EUR/CAD which has formed a downtrend channel over the past five weeks, forming lower highs and lower lows as the rallies have consistently been sold into. What is interesting is that the Fibonacci retracements of the 1.4760/1.5645 rally from Q4 2018 have played a key role in the turning points. The last three rallies have all been capped by the Fib levels, with the latest being 61.8% Fib around 1.5100. What has also been key in the past week has been the 76.4% Fib at 1.4970 which has been a basis of support. How the market responds to this 76.4% Fib level will again be key near term. If the support holds firm then a renewed shorting opportunity will likely arrive on a rebound to 61.8% Fib around 1.5100 at the top of the channel. The hourly chart shows near term price support is 1.4950 and a closing breach would open the road towards a full retracement to the 1.4760 low. The low of the downtrend channel comes in around 1.4900 which is also the old December low. It is also interesting to see momentum indicators solidly negatively configured as the Stochastics have given another bear cross sell signal and the RSI is tracking lower with downside potential. This suggests there is a negative bias and selling opportunities are preferred.
EUR/USD
There has been another significant threat to the range support around $1.1300 this week and so far this once more looks to be an area where the buyers will support. The bearish implications of Monday’s significant negative candle have been negated by an almost exact mirror image of a positive candle yesterday. With the rebound continuing today there has been a breach of the recent eight session trend lower and the outlook is picking up once more. Momentum indicators are ticking higher, with the RSI back above 40, Stochastics levelling off and even the MACD lines looking to stabilise. This is also reflected on the hourly chart momentum which is now more positively than at any time over the past week or so. There needs to be a move above the resistance $1.1350/$1.1360 whilst also holding consistently above a pivot support at $1.1320 in order for more conviction in the recovery process. This is still not a certain recovery, but the move is developing now. The subsequent resistance is at a mid-range pivot of $1.1420. A close back below $1.1300 would be a significant disappointment now.

Cable has rebounded in the past couple of sessions as the dollar has weakened. This is helping to strengthen what is a breakout support around $1.2815 (yesterday’s low at $1.2830 has added to this). For now this is still a corrective phase though, as there is a trend lower of the past couple of weeks, whilst the market is posting lower highs. However, there is a degree of stabilisation that is coming with another positive look to Cable today. The key for this session will be a pivot around $1.2920 which is initial resistance. For the bulls though, more needs to be done to suggest control, and for that there needs to be a push above the psychological $1.3000 which is also the latest reaction high. The hourly chart indicators are now looking far more positive, out of negative configuration and looking to set up more of a ranging formation. This adds to the conviction that broadly between $1.2800/$1.3000 Cable is a consolidation range play.

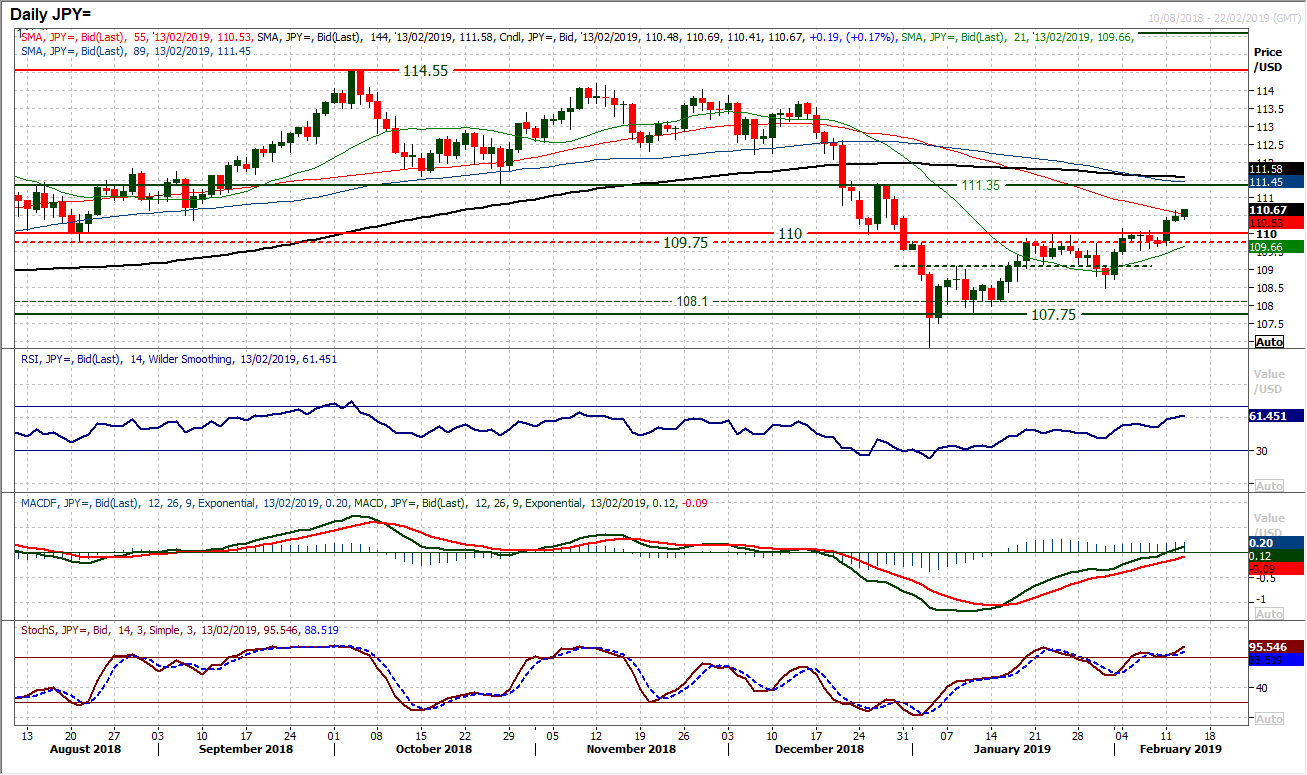
The yen is one of the major currencies which is not in recovery mode against the dollar. An improvement in risk appetite is hitting the yen more than the dollar and means that the breakout on Dollar/Yen above 110.00 remains on track. A mild positive candle yesterday has continued this morning. This comes with the daily momentum indicators continuing to tick higher, with the RSI rising into the 60s, Stochastics maintaining strong configuration and MACD lines rising through neutral. A more positive outlook has formed on the hourly momentum indicators with corrections now being bought into, with any drop into 35/50 on the hourly RSI being a chance to buy and around neutral on the hourly MACD lines too. There is a band of support forming between the 110.00 breakout and 110.30 which is becoming a near term buy zone now. A move towards the next key medium term pivot at 111.35 is open.
Gold
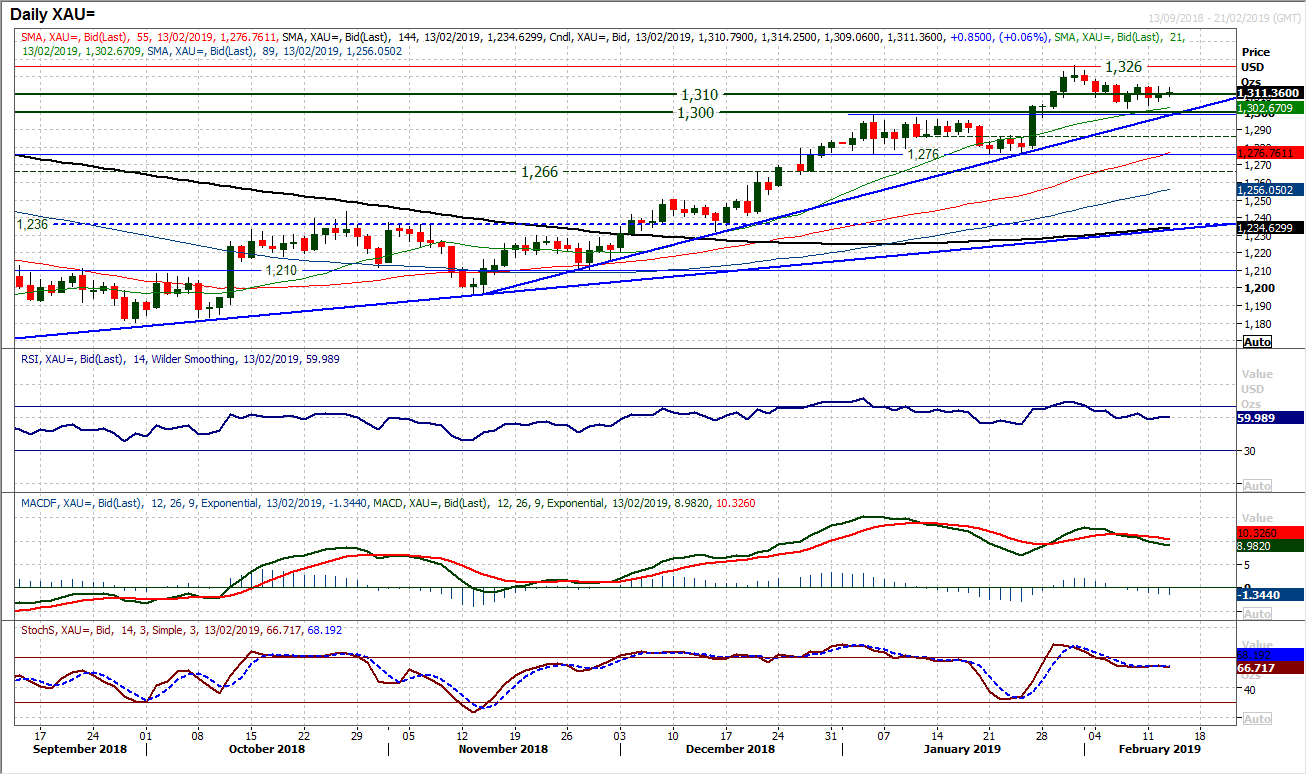
Yesterday was another session of trading around the support of the long term pivot band $1300/$1310 but as yet the buyers have been unable to drive for a renewed bull run. However, something looks to be brewing. The support of the 12 week uptrend comes in around $1298 today and this is means that the trend support is now pulling higher than the breakout of the old January highs at $1298. The move back from $1326 which has turned from being a correction into more of a consolidation above the growing support of the recent $1302 low. Momentum indicators have looked more settled in recent days too, with the Stochastics bottoming and RSI more stable around 60. The number of positive leaning candles is also growing. This suggests that whilst the bulls are still looking for their buy signal, the could be close. The hourly chart shows resistance for over a week has come around $1316 and a move above here would be a statement of intent from the bulls. Above $1316 would open $1326 again. For now though hourly momentum indicators reflect a near term range formation.
WTI Oil
With the bulls willing to support WTI again, support has formed around $51.25 (basically at the late January low) and a rebound has broken above a near term corrective downtrend. It is becoming increasingly clear that trend analysis on oil is, at least for now, a fruitless task. The market continues to play out within the range of support at $50.40 up towards resistance around $55.75 (effectively a 10% range). This is also coming between the Fibonacci retracements of the $76.90/$42.35 correction. 23.6% Fib is supportive at $50.50 and 38.2% Fib plays out as the range high at $55.55. Daily momentum indicators have stabilised their corrective slips and this has to be played as a range for now. The hourly chart shows the market trading above the near term pivot around $53.00 leaving a mild positive bias within the range again. Below $52.50 opens the range lows, whilst above the lower highs at $54.30 opens the highs again.

Dow Jones Industrial Average
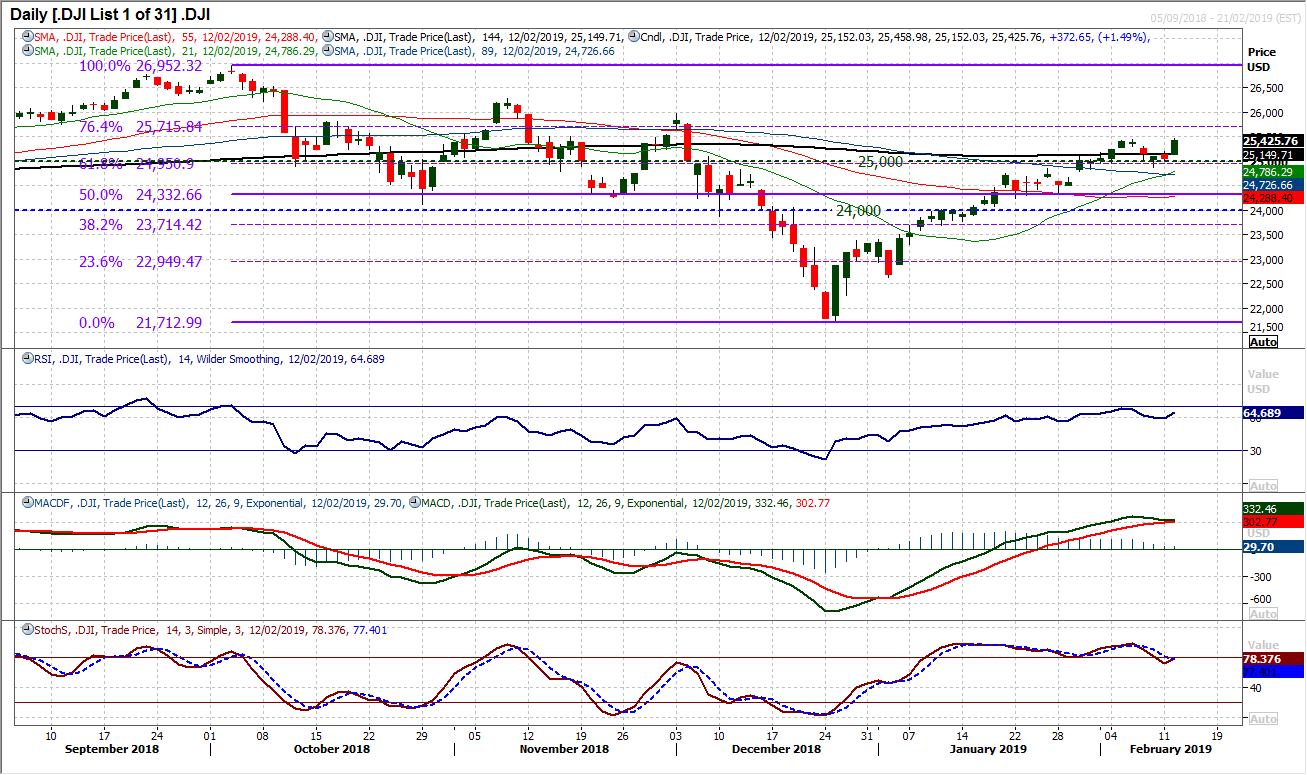
The rather tentative formation of support on Friday and Monday has decisively turned into a buying opportunity again as a huge positive session has seen the Dow climbing +1.5%. The market has also closed at its highest level since early December. The move has left key support of another higher low at 24,883 and once more the basis of support around a Fibonacci retracement has been seen (61.8% Fib at 24,950). This opens 76.4% Fib at 25,715 as the next target area. Momentum indicators are swinging higher once more with the RSI into the mid-60s and Stochastics ready to turn back into strong configuration. The bulls are once more looking positive for renewed move towards the next resistance at 25,980 and intraday weakness is a chance to buy.
Author

Richard Perry
Independent Analyst


