DJIA testing key level as investors weigh fundamental risks
Earlier today, we highlighted some of the fundamental risks facing equity investors. While we haven’t seen a clear breakdown in the major indices yet, meaning that the trend is still bullish, we can nonetheless map out the key battle grounds and highlight a few levels to watch in the event of a potential breakdown.
Out of the major US indices, the Dow Jones Industrial Average (DJIA) has been underperforming already over the past five days or so due, among other things, to the big falls in shares of Boeing. Therefore, if stocks were to go lower, the Dow might lead on the way down as it is already a weaker index relative to the S&P and Nasdaq.
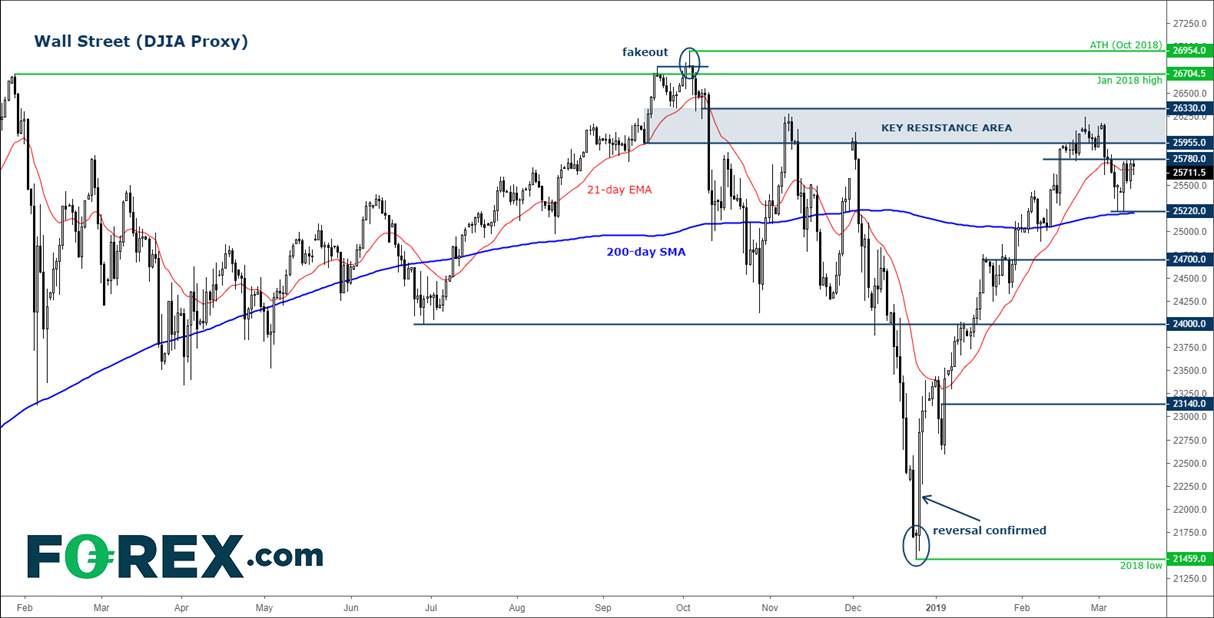
Overall, the technical picture still looks bullish. However, the index has tested and reacted from the key resistance area in the 25955-26330 region as highlighted on the chart, below.
Over the past three days, the Dow has been testing an intermediate resistance level around 25780 and so far, it has been unable to break above it.
Still, with the index holding its own above the 200-day moving average (which still has a positive slope, objectively telling us that the trend is indeed bullish) and above key support levels such as 25220 (which happens to converge with the 200 MA), the buyers remain in control.
However, if the 25220 support level were to break down in the coming days, only then things might get more interesting and we could see a more significant correction.
So, at this stage, the Dow is in neutral territory, meaning it could still go up, as it tests key technical resistance levels and as investors weigh fundamental risks facing the markets. The bears therefore may wish to wait for confirmation before stepping in, while the chasing bulls may wish to proceed with extra care given the sharp year-to-date gains.
Figure 1:
Author

Fawad Razaqzada
TradingCandles.com
Experience Fawad is an experienced analyst and economist having been involved in the financial markets since 2010 working for leading global FX, CFD and Spread Betting brokerages, most recently at FOREX.com and City Index.


