DJIA Elliott Wave: Buying the dips at the blue box

In this technical blog we’re going to take a quick look at the Elliott Wave charts of INDU published in members area of the Elliottwave-Forecast . As our members know, INDU is another index that has given us good trading opportunity recently. The index is showing incomplete sequences in the cycle from the March 2020 low, targeting 37090+ area. We recommended members to avoid selling and keep on buying the dips in 3,7,11 swings. Recently we got pull back that has given us opportunity to enter long trades again. In further text we’re going to explain the forecast and trading strategy.
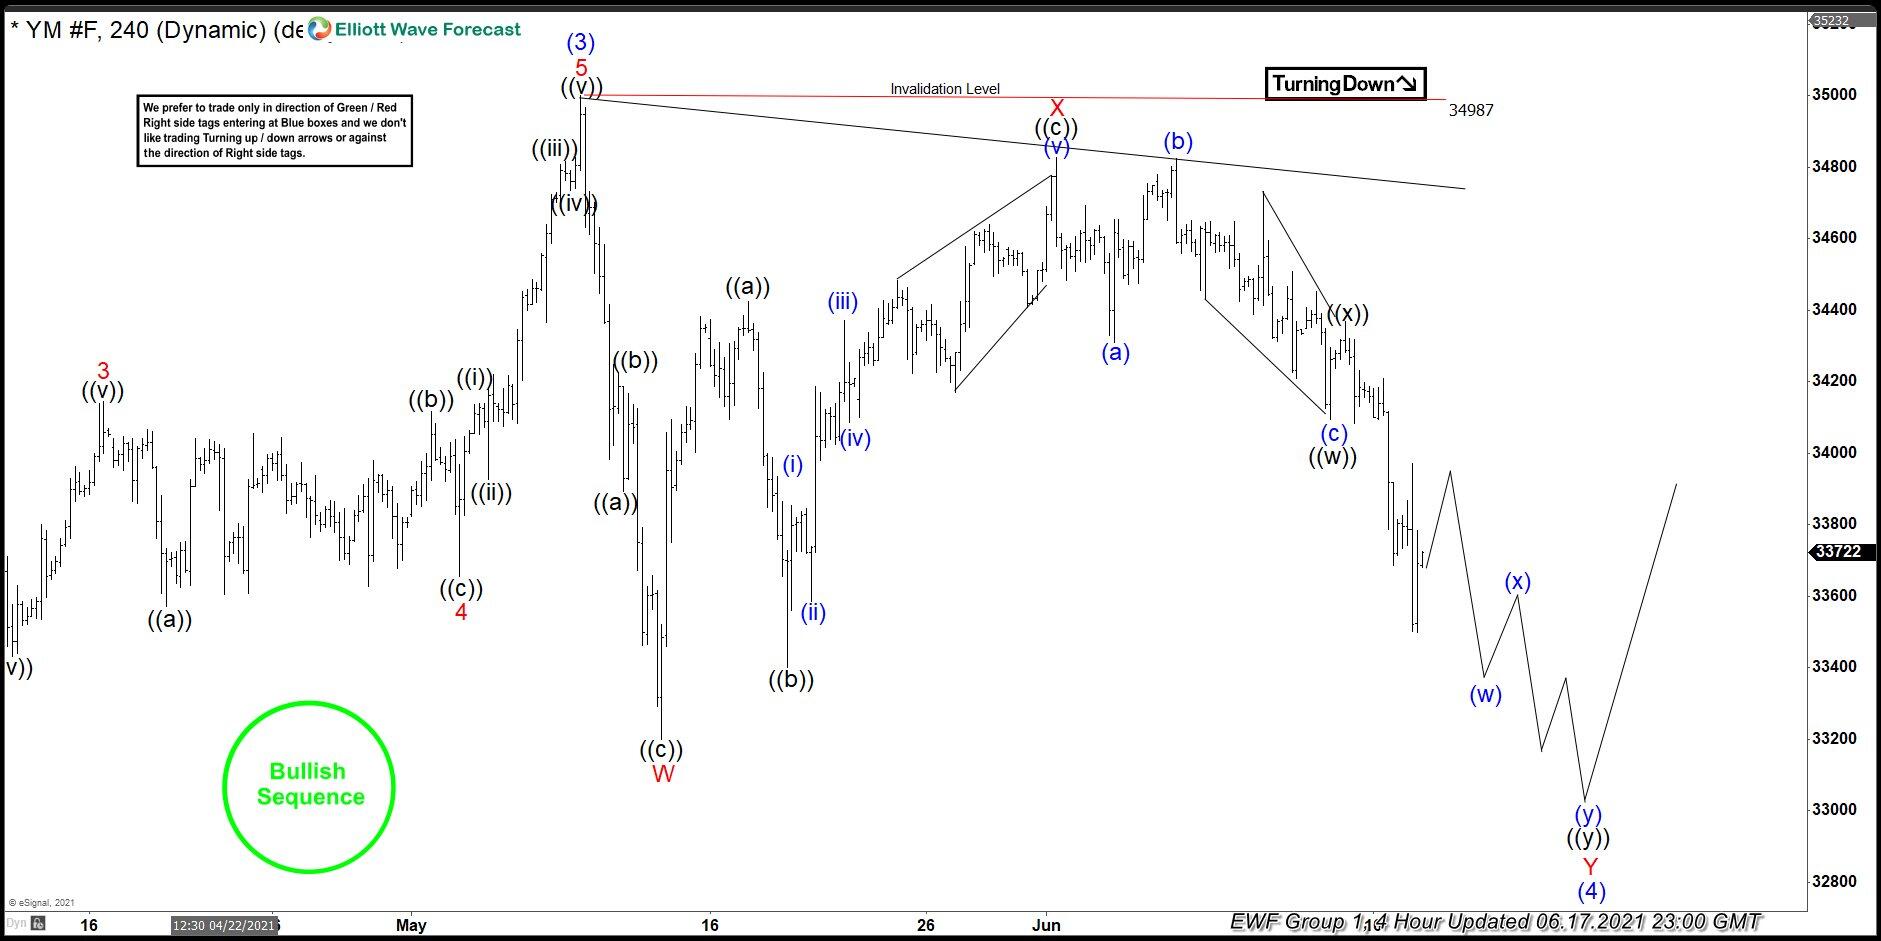
INDU 4 hour Asia Elliott Wave analysis 6.17.2021
Current view suggests INDU is doing (4) blue pull back. Correction looks incomplete at the moment, we believe INDU still could give us another leg down as proposed on the chart. Although calling for more short term weakness, we recommended members to avoid selling against the main bullish trend. Strategy is waiting for extremes from 34987 peak to be reached before entering long trades again. Extreme zone comes at 33026-32082 (buyers zone).
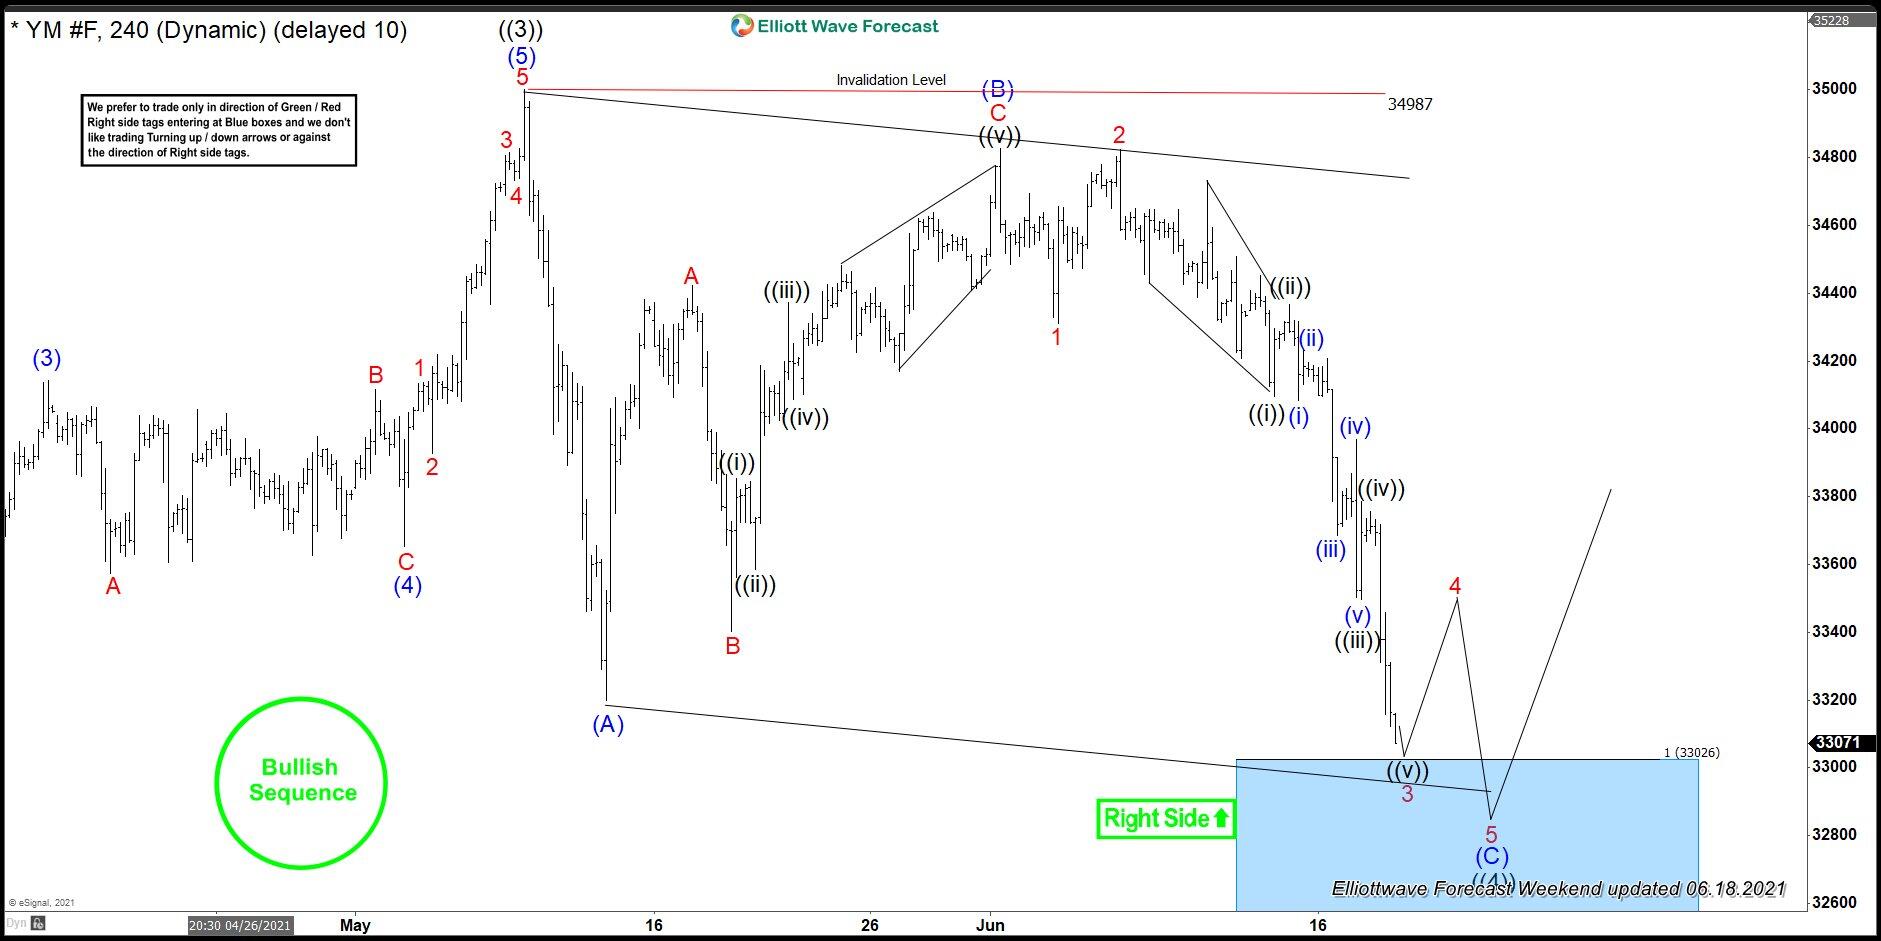
INDU 4 hour Asia Elliott Wave analysis 6.18.2021
INDU made the decline as we expected. However, price still has not reached extremes at 33026- 32082. We see potentially more downside toward Blue Box Area. At that zone we would like to be buyers, looking for further rally toward new highs ideally. As the main trend is bullish, we should get 3 wave bounce at least from the Blue Box buyers zone. Invalidation level for the trade would be break below 1.6148 fib extension (32082). As our members know, Blue Boxes are no enemy areas , giving us 85% chance to get a bounce. Once the price reaches 50 Fibs against the (B) blue peak, we will make long positions risk free (put SL at BE).
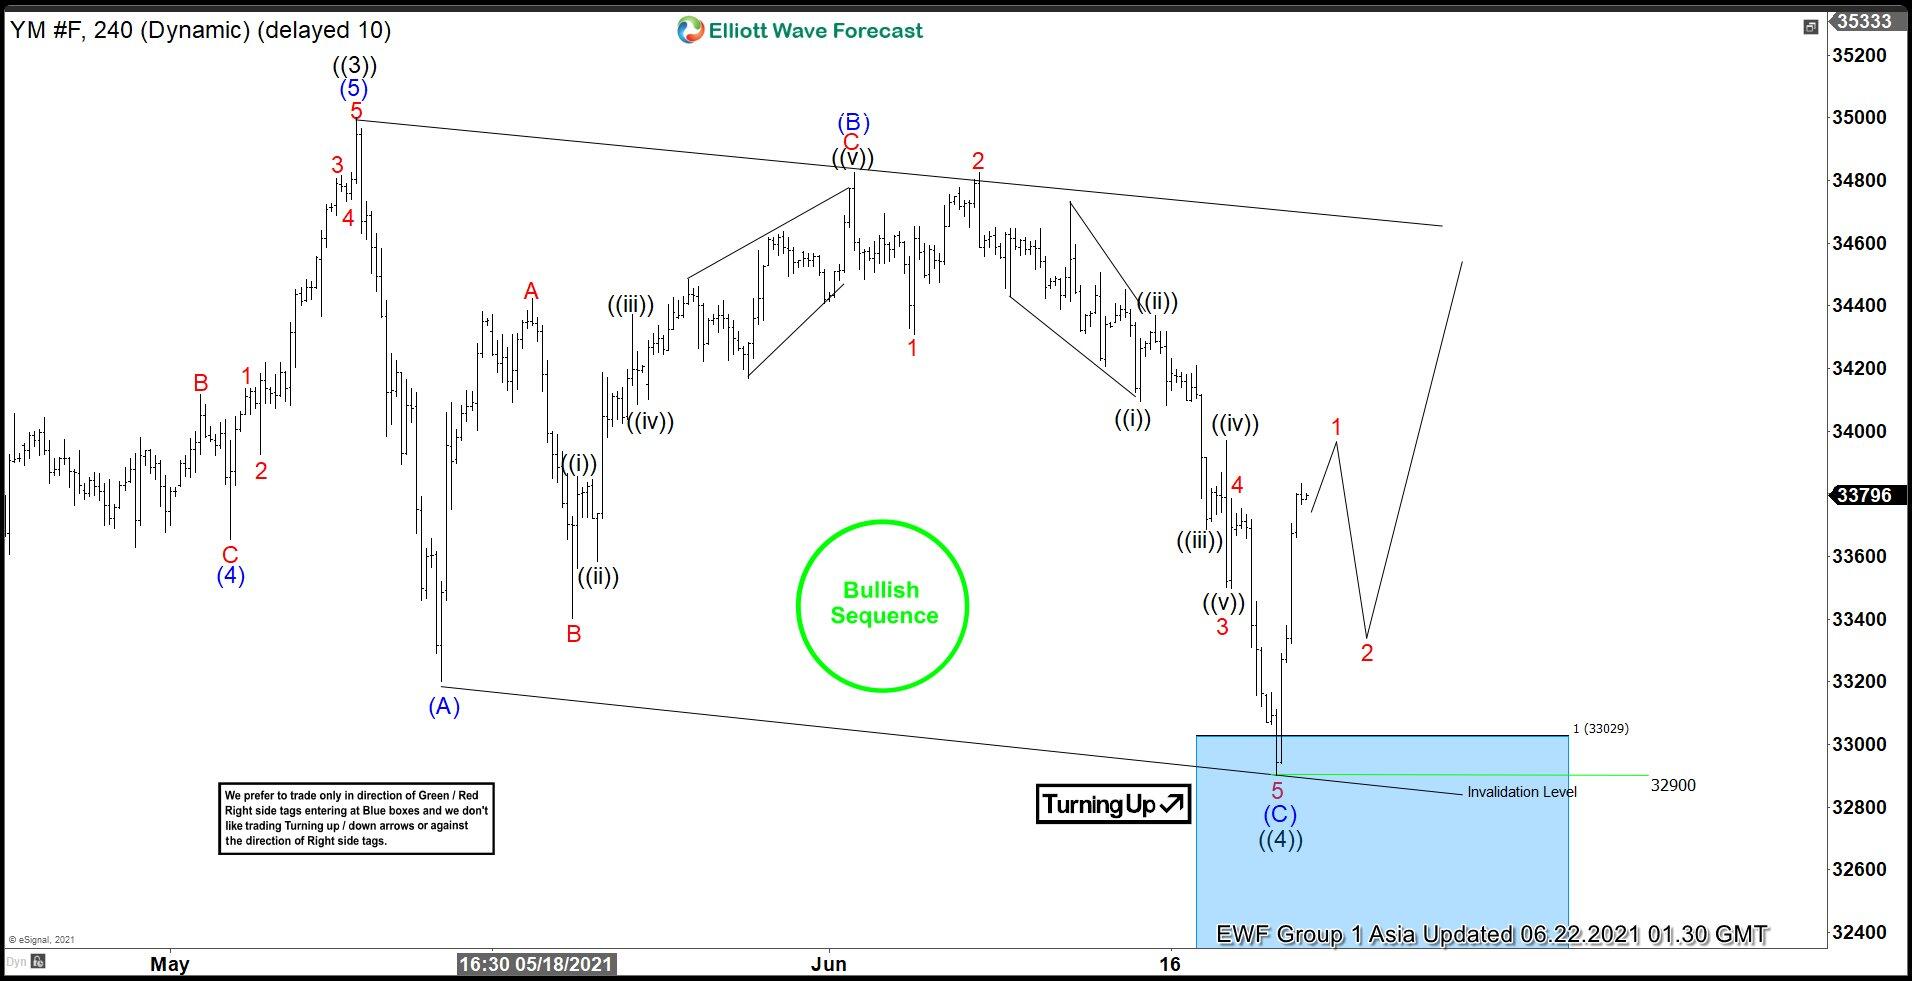
INDU 4 hour Asia Elliott Wave analysis 6.22.2021
INDU found buyers and gave us nice reaction from the blue box. Bounce reached 50 fibs against the connector (B) blue, so we put SL at BE and booked partial profits. Long trades are risk free at this stage. More aggressive view suggests pull back is completed at 33029 low. As far as the price stays above 32900 low, next leg up could be in progress. Alternatively if it breaks it , we will be out the trade without loss or with minimal loss.
Author

Elliott Wave Forecast Team
ElliottWave-Forecast.com


