Since the start of JuIy, the two weakest G10 currencies have been the New Zealand dollar and the Swedish krone (SEK). We've selected the start of July as this is when EUR/USD was moving higher and peaked at 1.37. Although a weak euro has since fallen 1000 pips, the Swedish krone has been even weaker in percentage terms. Therefore, we're looking for buying opportunities in USD/SEK. While there haven't been many large pullbacks of recent months, USD/SEK may be working through a minor pullback right now which we're interested to trade.
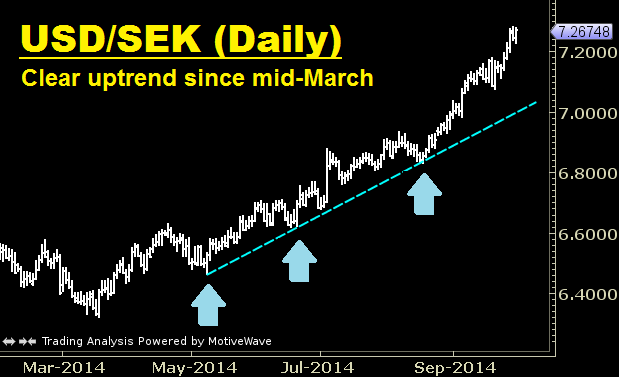
This daily USD/SEK chart shows the price action for most of 2014. It also shows a clear three-touch blue uptrend which could be extended to at least mid March 2014. Recent price action has accelerated and is quite a way above that trend line, essentially requiring a steeper trend line. This is part of the reason we're keen on waiting for a pullback before joining the current uptrend.
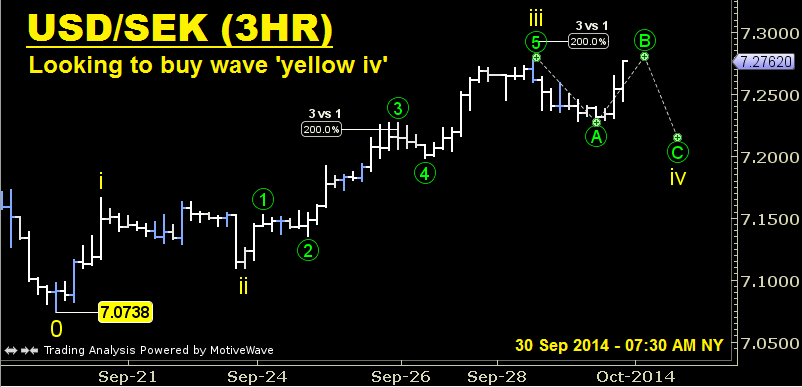
This three-hour USD/SEK chart shows the price action from the 7.0738 low and includes a suggested Elliott Wave count from that level. On this count, we've seen three yellow waves higher and are currently correcting in wave 'yellow iv'. We expect this correction to be a flat or a triangle. While we can't determine which structure may win out, we'll discuss a trade setup in expectation of a flat. If we eventually see a triangle, our entry won't be triggered and we'll nominate a level to cancel orders.
Therefore, we’d look to buy USD/SEK at (or below) 7.23 which is slightly above the wave 'green circle 3' high. Our stop will be at 7.1850 which is slightly below the wave 'green circle 4' low. We'll set two 'take profit' targets of 7.29 and 7.32.
Long Setup for USD/SEK
Trade: Buy at (or below) 7.23.
Stop Loss: Place stop at 7.1850.
Take Profit: The two ‘take profit’ targets are 7.29 and 7.32.
Trade Management: If price reaches 7.30 without triggering the entry, cancel all orders. Further, if the entry is triggered and price reaches the first take profit target of 7.29, raise stop to 7.23.
Recommended Content
Editors’ Picks
AUD/USD regains the constructive outlook above the 200-day SMA

AUD/USD advanced strongly for the second session in a row, this time extending the recovery to the upper 0.6500s and shifting its focus to the weekly highs in the 0.6580-0.6585 band, an area coincident with the 100-day SMA.
EUR/USD keeps the bullish performance above 1.0700

The continuation of the sell-off in the Greenback in the wake of the FOMC gathering helped EUR/USD extend its bounce off Wednesday’s lows near 1.0650, advancing past the 1.0700 hurdle ahead of the crucial release of US NFP on Friday.
Gold stuck around $2,300 as market players lack directional conviction

Gold extended its daily slide and dropped below $2,290 in the second half of the day on Thursday. The benchmark 10-year US Treasury bond yield erased its daily losses after US data, causing XAU/USD to stretch lower ahead of Friday's US jobs data.
Bitcoin price rises 5% as BlackRock anticipates a new wave of capital inflows into BTC ETFs from investors

Bitcoin (BTC) price slid to the depths of $56,552 on Wednesday as the cryptocurrency market tried to front run the Federal Open Market Committee (FOMC) meeting. The flash crash saw millions in positions get liquidated.
FOMC in the rear-view mirror – NFP eyed

The update from May’s FOMC rate announcement proved more dovish than expected, which naturally weighed on the US dollar (sending the DXY to lows of 105.44) and US yields, as well as, initially at least, underpinning major US equity indices.

