 DAILY USD/CHF TECHNICAL OUTLOOK
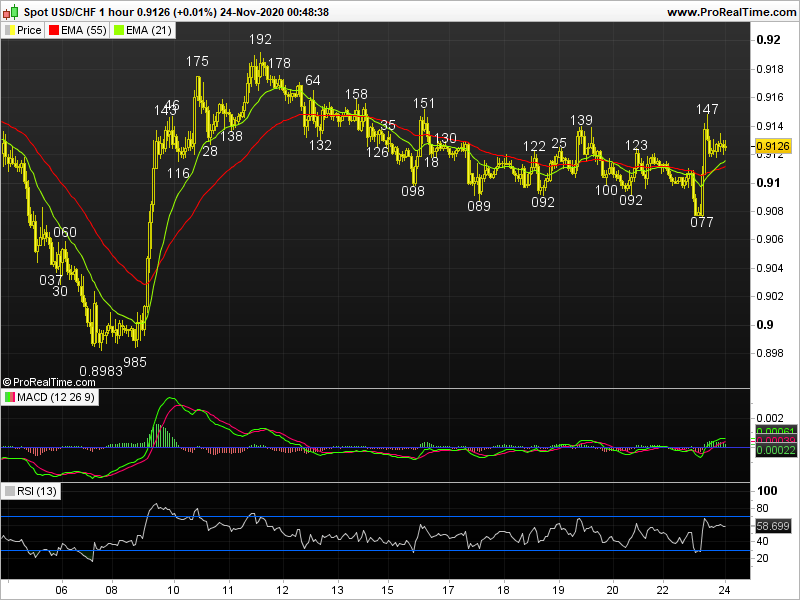
Last Update At 24 Nov 2020 00:48GMT
Trend Daily Chart
Sideways
Daily Indicators
Neutral
21 HR EMA
0.9115
55 HR EMA
0.9111
Trend Hourly Chart
Near term up
Hourly Indicators
Rising
13 HR RSI
8
14 HR DMI
+ve
Daily Analysis
Consolidation with upside bias
Resistance
0.9192 - Nov 11 high
0.9175 - Nov 10 high
0.9151 - Last week's high (Mon)
Support
0.9077 - Mon's low
0.9060 - Nov 06 high (now sup)
0.9031 - Oct's low (21)
USD/CHF - 0.9125.. Although dlr met renewed selling at 0.9114 in NZ on Mon n fell to a 13-day low at 0.9077 in NY morning, price then jumped to 0.9147 after release of robust US PMIs b4 retreating to 0.9119 on profit-taking.
On the bigger picture, despite dlr's rally fm Sep's bottom at 0.8999 to 0.9296 in late Sep, subsequent erratic fall to 0.9031 n Nov's brief break of 0.8999 to a fresh 5-1/2 year 0.8983 low in post-NFP NY due to usd's broad-based weakness signals LT downtrend fm 2016 peak at 1.0344 has once again resumed. However, dlr's rally to 0.9192 in Nov suggests temp. low is made n subsequent retreat to 0.9089 last week would bring range trading. As long as 0.9030/40 holds , re-test of 0.9192 may be seen but abv 0.9207 (Nov high) needed for stronger retrace. to 0.9296. On the downside, daily close below 0.9031 (Oct low) signals recovery has ended n yields re-test of 0.8983, below extend twd 0.8900 in Dec.
Today, despite dlr's resumption of decline fm 0.9192 to 0.9077 y'day, subsequent jump to 0.9147 suggests temporary low is made n range trading would be seen b4 re-test of 0.9192, however, 'bearish divergences' should cap price below Nov's 0.9207 peak today. Below 0.9077 risks 0.9060, then 0.9030/35 later.
Trendsetter does not warrant or guarantee the accuracy, timeliness or completeness to its service or information contained therein. Trendsetter does not give, whatsoever, warranties, expressed or implied, to the results to be obtained by using its services or information it provided. Users are trading on their own risk and Trendsetter shall not be responsible under any circumstances for the consequences of such activities. Trendsetter and its affiliates, in no event, be liable to users or any third parties for any consequential damages, however arising, including but not limited to damages caused by negligence whether such damages were foreseen or unforeseen.
Recommended Content
Editors’ Picks
EUR/USD holds above 1.0700 ahead of key US data

EUR/USD trades in a tight range above 1.0700 in the early European session on Friday. The US Dollar struggles to gather strength ahead of key PCE Price Index data, the Fed's preferred gauge of inflation, and helps the pair hold its ground.
USD/JPY stays above 156.00 after BoJ Governor Ueda's comments

USD/JPY holds above 156.00 after surging above this level with the initial reaction to the Bank of Japan's decision to leave the policy settings unchanged. BoJ Governor said weak Yen was not impacting prices but added that they will watch FX developments closely.
Gold price oscillates in a range as the focus remains glued to the US PCE Price Index

Gold price struggles to attract any meaningful buyers amid the emergence of fresh USD buying. Bets that the Fed will keep rates higher for longer amid sticky inflation help revive the USD demand.
Sei Price Prediction: SEI is in the zone of interest after a 10% leap

Sei price has been in recovery mode for almost ten days now, following a fall of almost 65% beginning in mid-March. While the SEI bulls continue to show strength, the uptrend could prove premature as massive bearish sentiment hovers above the altcoin’s price.
US core PCE inflation set to signal firm price pressures as markets delay Federal Reserve rate cut bets

The core PCE Price Index, which excludes volatile food and energy prices, is seen as the more influential measure of inflation in terms of Fed positioning. The index is forecast to rise 0.3% on a monthly basis in March, matching February’s increase.