![]() Richard Perry
Richard Perry
Independent Analyst
Market Overview
Market sentiment is looking somewhat mixed again this morning as despite a corrective move on the dollar and further gains on the oil price, there has been slight tempering of the risk appetite that has driven some strong moves on equities in recent days. The dollar weakness comes as traders look ahead to the announcement of key US data to end the week (Durable Goods today and GDP tomorrow) and the prospect of a Janet Yellen speech that could define trading for the coming weeks, perhaps a little caution is not to be unexpected. Wall Street may have closed with gains of +0.7% on the S&P 500 but Asian markets have been more reserved following a cautious looking Tankan survey, with the Nikkei +0.1%. European markets have also begun the day very mildly higher.
Early moves on the forex markets show the dollar is under a bit of pressure today, trading weaker against all of the forex majors, with just one exception, the Kiwi which is underperforming after lower than expected Fonterra milk price forecasts. With the dollar correction, there has finally been some support that has come in for gold today which is trading around $5 up on the day, whilst silver is also bouncing. The oil price also continues to creep higher with Brent Crude hitting over $50 today.
Traders will be looking out for the second reading of UK Q1 GDP at 0930BST which is expected to stick at +0.4% from the preliminary reading. The US Durable Goods Orders are at 1330BST which are expected to show a core month on month improvement of +0.3%. The US weekly jobless claims are also at 1330BST and are expected to stay around to levels of last week with 275,000 (277,000 last week). US Pending Home Sales are also at 1500BST which are expected to improve by +0.6% on the month.
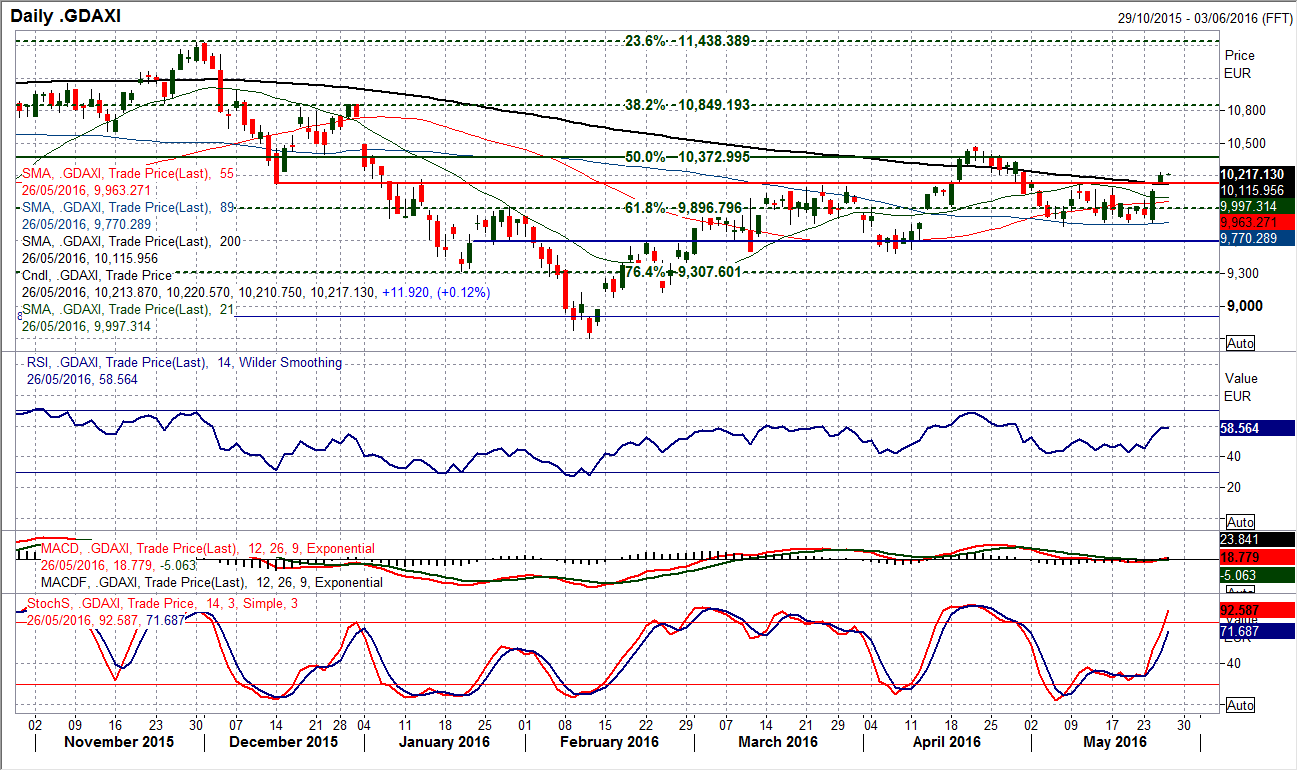
Chart of the Day – DAX Xetra
Has the DAX finally broken the shackles of the near term consolidation? The strongest bull candle in months (which was also a bullish engulfing) on Wednesday, encouraged the bulls to surge back in for yesterday’s bullish breakout above the long term old resistance band around 10,120. Daily momentum indicators show a strong upside improvement with the Stochastics accelerating higher, the RSI approaching 60 and with the upside potential to continue in the coming days for another move towards the band of resistance from the 50% Fibonacci retracement of 8355/12,390 at 10,373 and the April highs of 10,475. The hourly chart reflects the near term overbought position and this could induce a correction still. The bullish breakout has left a near term gap at 10,078 and the early pullback this morning means that this will be open. There is a band of support of around 40 ticks between 10,078/10,120 for a retracement.
EUR/USD
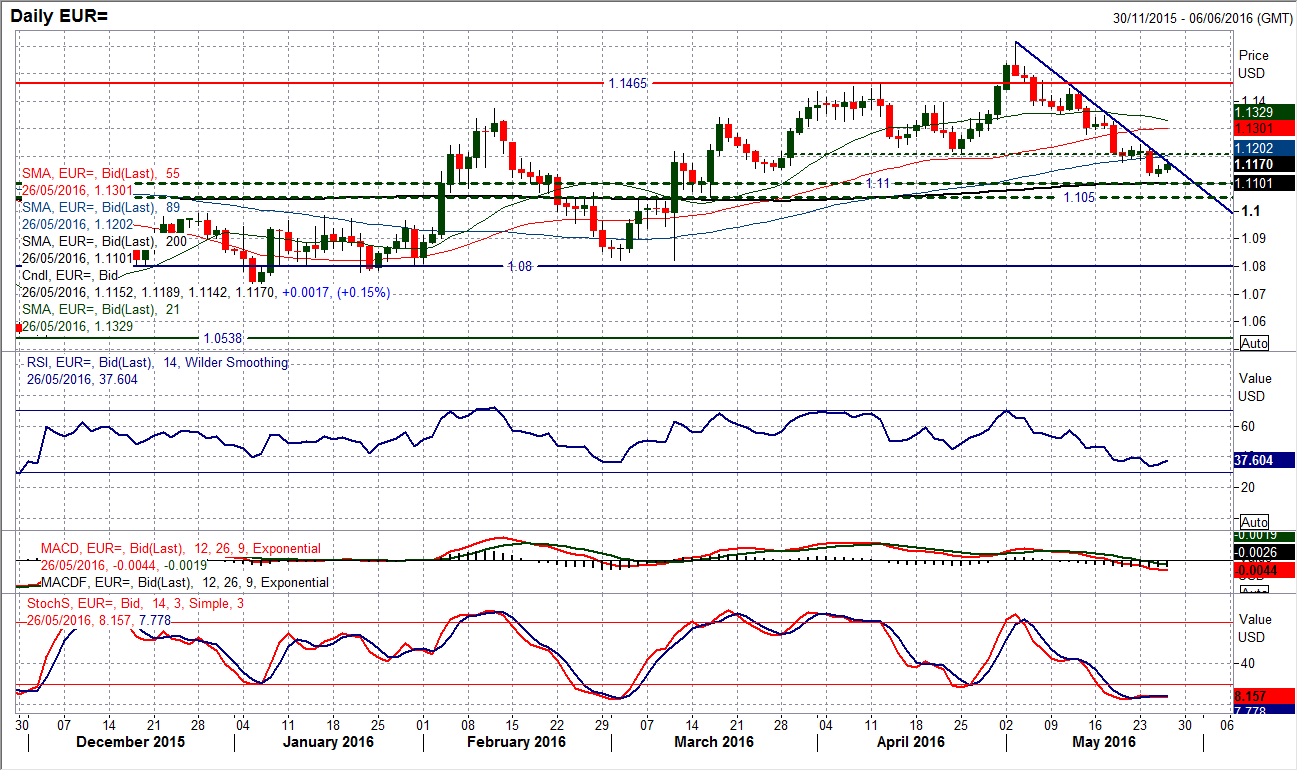
Once more the dollar strength is being questioned and this means that the recent downtrend on EUR/USD is coming under some scrutiny. These periods of consolidation with a minor rally have been seen on several occasions during the past few weeks, but time and again they have been sold into. The configuration on the momentum indicators suggests there is little reason to believe that there is an imminent rally to be expected on EUR/USD. The hourly chart shows that the resistance band initially is $1.1180/$1.1200, and the hourly momentum indicators have now unwound. A move above $1.1245 would be a signal for the bulls fighting back, but until this is seen I still favour a move back towards the $1.1100 long term pivot.
GBP/USD
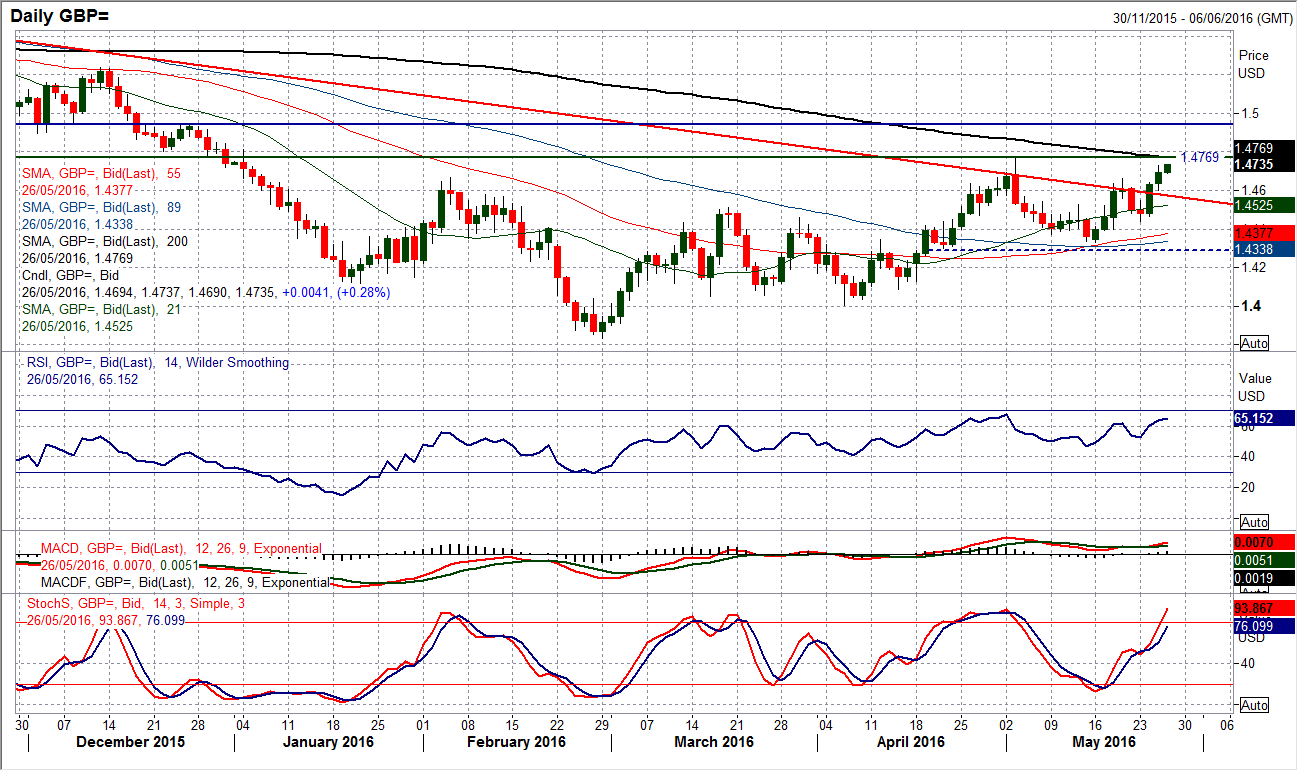
The improvement on Cable continues and the break higher through $1.4660 looks to be suggesting a change of mind-set for traders. Previously, the longer term downtrend had been preventing the rallies of April and May gaining traction but this latest move has now traded a full session clear of the downtrend and this confirms the medium term improvement for the bulls. The near term momentum indicators are strengthening with the Stochastics accelerating higher and the RSI above 60. The overhead resistance comes in at $1.4770 an looks ready for a test today. A breakout above $1.4770 opens $1.4950. There are a couple of caveats to the positive outlook and that is that the move has been built on the opinion polls for the Brexit and polls tend to be volatile. Also that Janet Yellen speaks at Harvard tomorrow and her comments could form the basis of a direction on Cable for the coming few days.
USD/JPY
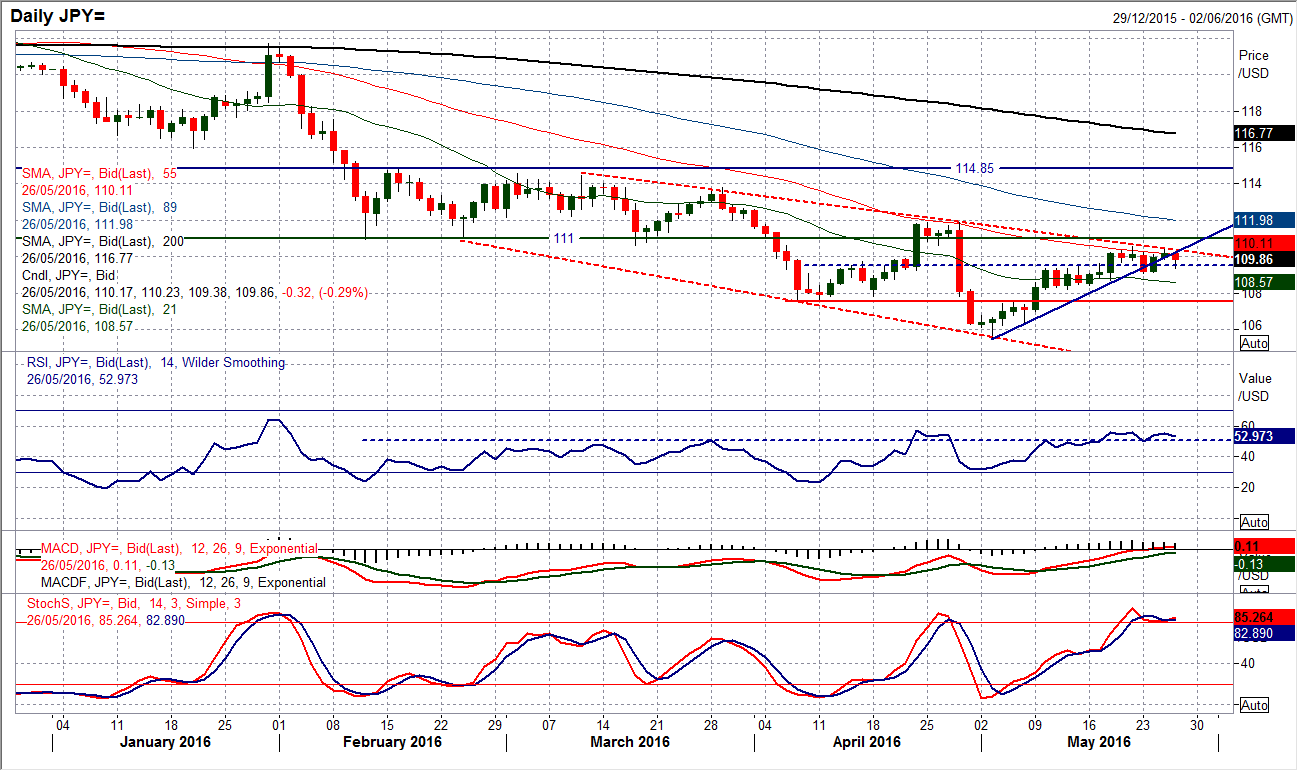
The questions over the ability for the bulls to make the decisive breakout have only increased as once more the market looks to be shying away from the overhead resistance signals. The downtrend over the past 8 to 10 weeks continues to be a barrier, whilst the momentum indicators look to be in the process of rolling over. The 55 day moving average is at 110.11 and adds to the resistance, whilst 110.60 up towards 111.00 is significant overhead supply. The hourly chart shows that now the 3 week recovery uptrend has been breached it is being used as a basis of resistance too. Initial support is at 109.10 whilst 108.70 is also an important near term level. There is a significant degree of uncertainty over the next breakout, but it does not appear that the bulls are ready yet to grasp decisive control. Near term resistance today comes in with a minor pivot around 109.80 before 110.40 which was yesterday’s high.
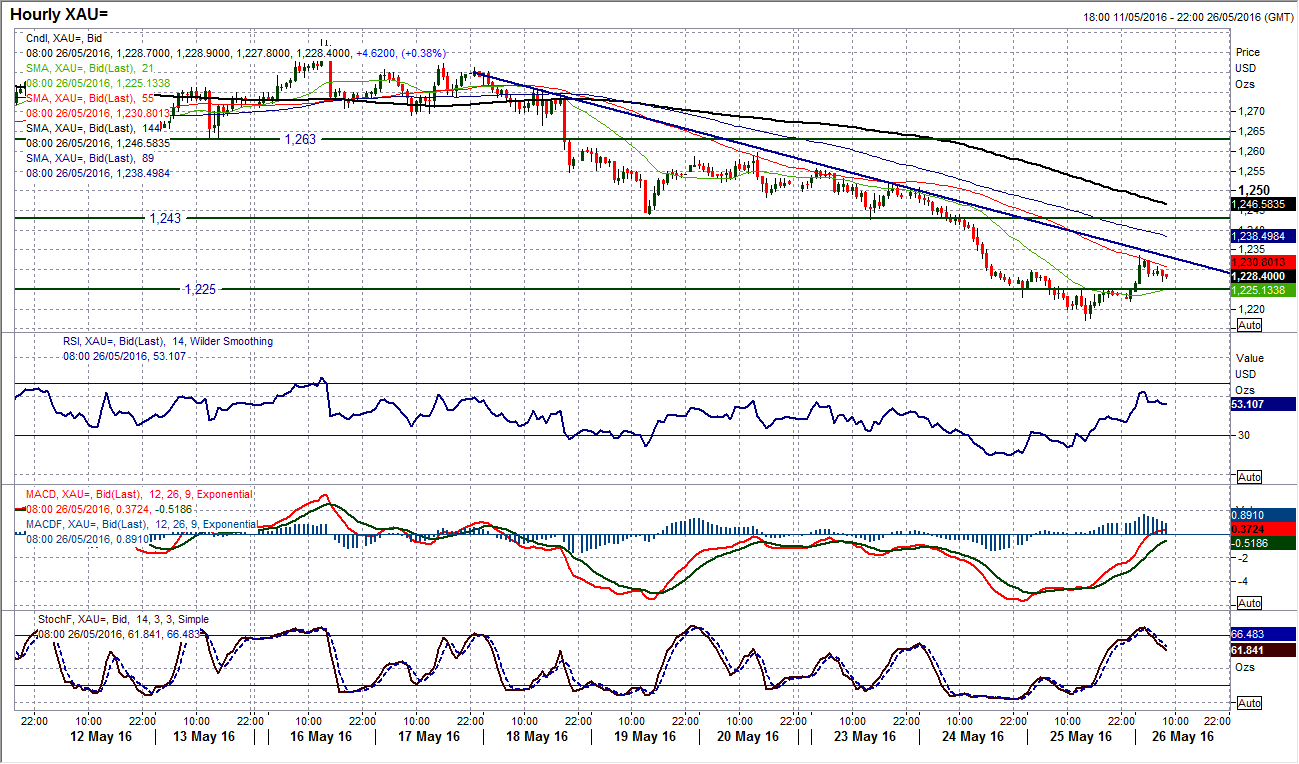
Gold
As the dollar has corrected this morning there has been a minor recovery on gold. This comes after the loss of over $60 in the past 6 completed sessions. The deterioration in the technical outlook in the past few weeks has meant that the bulls have lost control. However I am not bearish, instead I see gold as more of a choppy range play once more. At the moment this bounce needs to be watched as it could still be a near term corrective move within the recent sell-off. I discussed in the daily video yesterday that there was a downtrend on the hourly chart now which is flanked by the falling 55 hour moving average. This trend lower is being tested now, however, already the hourly indicators are beginning to roll over and question the recovery from $1217.25. The corrective move would remain intact whilst gold continues to trade below the pivot at $1243. This rebound looks to be another chance to sell today for a retest of the $1217.25 low and a possible full retracement towards the key medium term support around $1208.
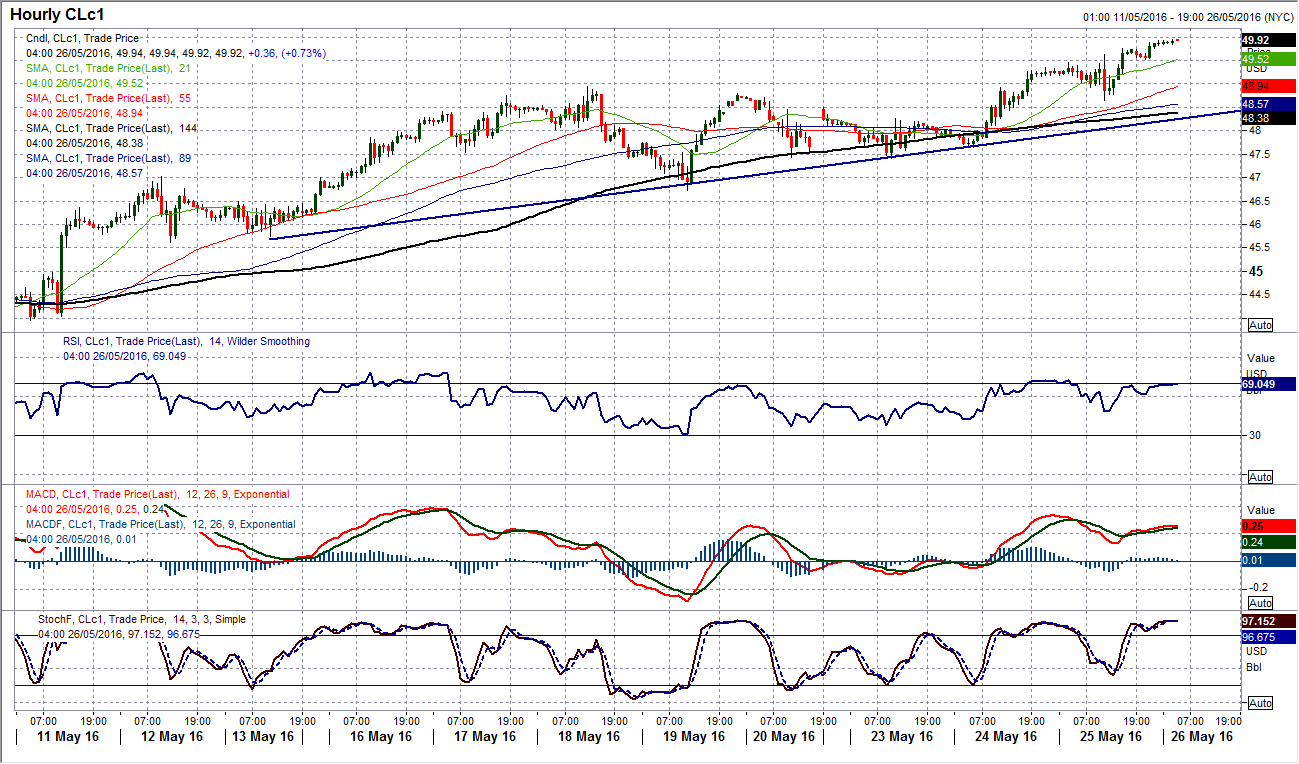
WTI Oil
Breaking higher from the near term consolidation suggests that corrections should continue to be seen as a chance to buy. The sequence of higher lows continues and the higher than expected EIA draw on inventories (of -4.2m barrels) has once more fuelled the move. There is now a support band $46.70/$47.50 with which the bulls can use as a strong near term reference for the outlook. However, nearer term, yesterday’s reaction low at $48.65 is supportive. The drift higher therefore continues, but the issue for the bulls is the RSI which is now at 72 suggests there could be limited upside potential (as 70 has been limiting on the RSI for the past two or three months). Despite this though, what could continue to be seen is a slow and steady, near term choppy move higher. In this the intraday corrections need to be seen as a chance to buy for a test of the big overhead resistance at $50.92. The round number at $50.00 could also play a role in psychological resistance.
Note: All information on this page is subject to change. The use of this website constitutes acceptance of our user agreement. Please read our privacy policy and legal disclaimer. Opinions expressed at FXstreet.com are those of the individual authors and do not necessarily represent the opinion of FXstreet.com or its management. Risk Disclosure: Trading foreign exchange on margin carries a high level of risk, and may not be suitable for all investors. The high degree of leverage can work against you as well as for you. Before deciding to invest in foreign exchange you should carefully consider your investment objectives, level of experience, and risk appetite. The possibility exists that you could sustain a loss of some or all of your initial investment and therefore you should not invest money that you cannot afford to lose. You should be aware of all the risks associated with foreign exchange trading, and seek advice from an independent financial advisor if you have any doubts.
Recommended Content
Editors’ Picks
AUD/USD regains the constructive outlook above the 200-day SMA

AUD/USD advanced strongly for the second session in a row, this time extending the recovery to the upper 0.6500s and shifting its focus to the weekly highs in the 0.6580-0.6585 band, an area coincident with the 100-day SMA.
EUR/USD keeps the bullish performance above 1.0700

The continuation of the sell-off in the Greenback in the wake of the FOMC gathering helped EUR/USD extend its bounce off Wednesday’s lows near 1.0650, advancing past the 1.0700 hurdle ahead of the crucial release of US NFP on Friday.
Gold stuck around $2,300 as market players lack directional conviction

Gold extended its daily slide and dropped below $2,290 in the second half of the day on Thursday. The benchmark 10-year US Treasury bond yield erased its daily losses after US data, causing XAU/USD to stretch lower ahead of Friday's US jobs data.
Bitcoin price rises 5% as BlackRock anticipates a new wave of capital inflows into BTC ETFs from investors

Bitcoin (BTC) price slid to the depths of $56,552 on Wednesday as the cryptocurrency market tried to front run the Federal Open Market Committee (FOMC) meeting. The flash crash saw millions in positions get liquidated.
FOMC in the rear-view mirror – NFP eyed

The update from May’s FOMC rate announcement proved more dovish than expected, which naturally weighed on the US dollar (sending the DXY to lows of 105.44) and US yields, as well as, initially at least, underpinning major US equity indices.