Market Overview
Market sentiment has dramatically improved again. I discussed in my blog yesterday about what could drive the bottom in the recent selling pressure. One of the factors I discussed was rhetoric of FOMC members this week suggesting that September was no longer on the table for a rate hike. Well, Bill Dudley (New York Fed President),a voting member on the FOMC, suggested that the chances of a September rate hike were less compelling now. Wall Street has rallied dramatically with these dovish comments (and better than expected Durable Goods Orders) to see its best one day move since 2011. This does not clear up the rudimental issue of why the markets have been so panicked (falling Chinese demand and the Federal Reserve on a tightening path) but it does perhaps press the pause button, which will allow markets to settle down in the near term.
So with improving sentiment on Wall Street, the Asian markets have rallied strongly overnight. Even the Shanghai market has managed to pull some gains, whilst the Japanese Nikkei 225 was up 0.8%. European markets have been extremely volatile in the past few sessions (as have most markets) and again they are reacting to Wall Street with strong gains at the open. The big question is whether they can hold on to these gains this time?
Forex markets are just unwinding some of the dollar strength that was seen yesterday. It will be interesting to see if this move continues today as the Jackson Hole economic symposium begins. This could drive volatility around the dollar as FOMC members make comments over their views on monetary policy. The gold price has found support after 3 days of selling pressure. Interestingly also, the price of oil seems to have temporarily seen its downside pressure abate.
Traders will be looking out for the preliminary reading of US GDP today at 1330BST. The first revision of the growth data is expected to show an upward alteration to 3.2% (annualised) from the Advance reading of 2.3%. At the same time there the weekly jobless claims are announced which is once more expected to stay around last week’s 277,000 with a reading of 275,000. At 1500BST the pending home sales are forecast to show 1.3% growth (last month -1.8%).
Chart of the Day – NZD/USD
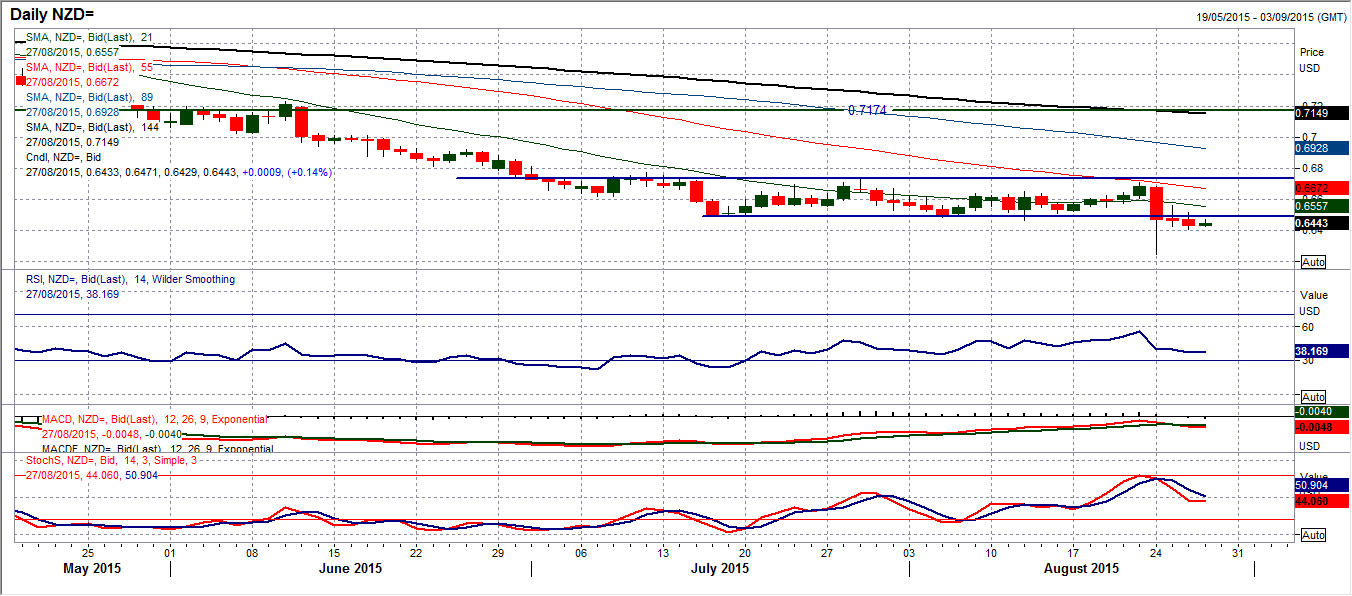
The Kiwi has not yet been able to recover from Monday’s incredible spike lower. The sharply bearish candle posted on that day of huge volatility is still a dark legacy for this chart. The subsequent days have seen further weakness and consolidation below the previous support band around $0.6500. The momentum indicators are in bearish configuration still and suggests that any rallies are once more a chance to sell. The MACD lines crossing back lower is an indication of this, whilst the RSI and Stochastics show further downside potential. The intraday hourly chart reflects this outlook with a series of lower highs, initially on Tuesday around the $0.6550 pivot and then around the old support turned new resistance at $0.6500. The rebound today has also subsequently rolled over as the hourly RSI is failing again around the 50 mark and Stochastics are also turning lower too. This suggests retesting yesterday’s low at $0.6407 as the drift back towards the spike low at $0.6244 continues.
EUR/USD
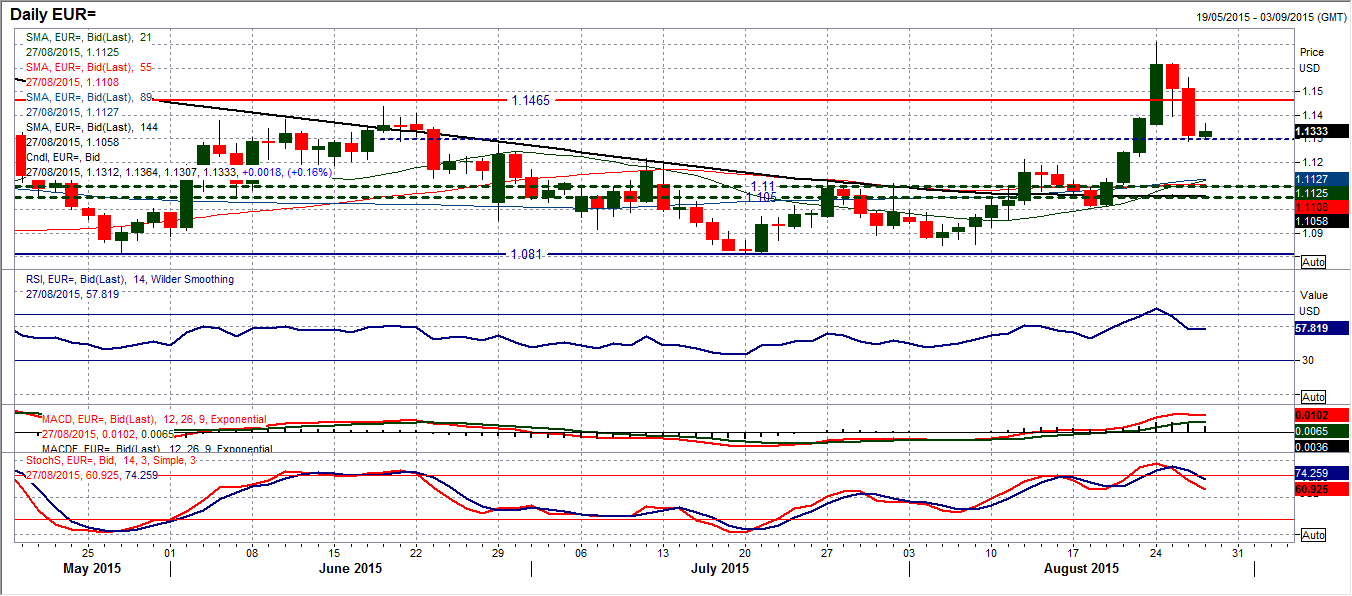
The fact that it has taken just two days to unwind Monday’s 350 pip move to the upside suggests that the market is still not settled. This comes despite a slight element of support coming in today. I said yesterday that sometimes you just need to let the dust settle on these big moves and yet still it is difficult to gauge definitive direction. The momentum indicators on the daily chart have started to reverse but still do not look too bad. If the euro can start to build support around this $1.1300 level then we may see the momentum indicators in a configuration that would suggest the bulls have not total lost control. For me the RSI needs to stay above the reaction low at 49 and Stochastics need to hold above their equivalent low (around the low 60s). The intraday hourly chart interestingly shows the correction finding a low as the hourly RSI was hitting 30. The main test for the bulls today will be the initial resistance of the low at $1.1400. If a consistent move back above that barrier can be seen then they can start to gain in confidence again. A failure of yesterday’s reaction low at $1.1289 would re-open the old support band around $1.1215. This remains a chart full of volatility and strong moves, not for the feint hearted.
GBP/USD
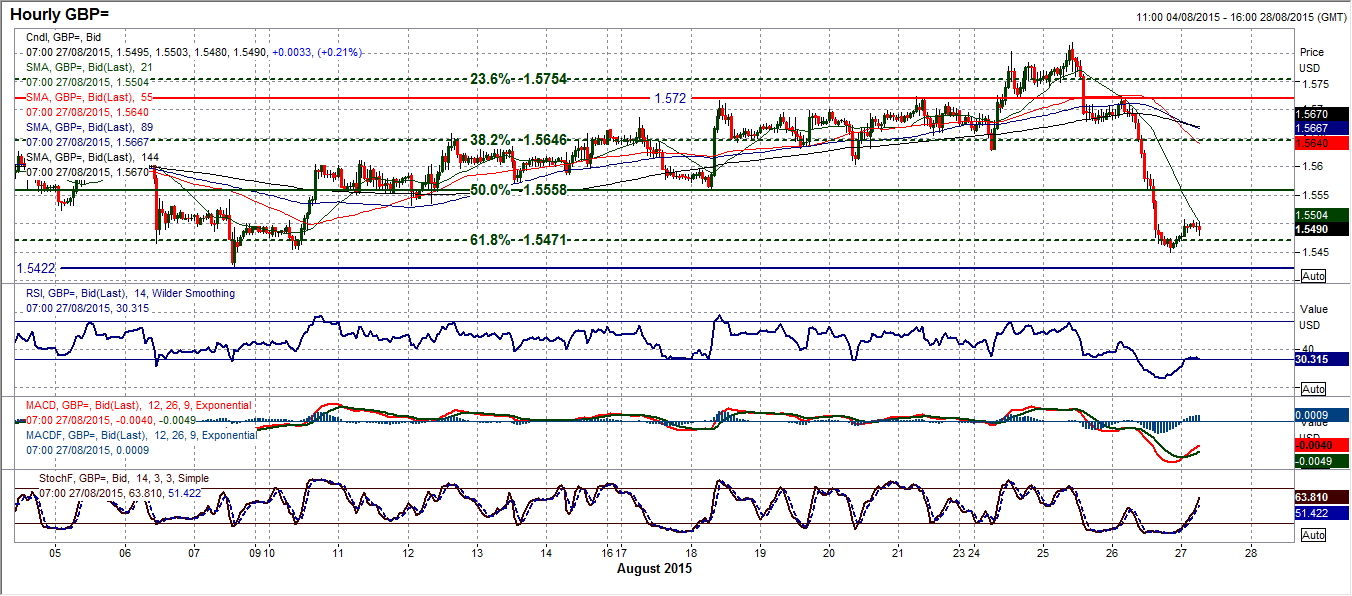
You take the stairs up and the elevator back down again. In one day almost the entire move higher on Cable over the past two weeks has been lost. The sharp intraday decline of 270 pips from $1.5720 have dragged the pair back for an immediate test of the support at $1.5422. Again, this just reflects the choppy trading that I expect to see on Cable throughout the coming weeks (and possibly months). Finding (and probably more pertinently holding on to) a decisive trend will be difficult. And so we must now completely reassess the outlook. For now clearly the sellers have the upper hand, despite an intraday rebound through the Asian session that has added initially around 40/50 ticks. I will once more hark back to the Fibonacci retracement levels on the intraday hourly chart in order to provide me with some guidance. The 61.8% Fib retracement of $1.5188/$1.5928 comes in at $1.5470 and has provided an initial basis of support. Subsequently 50% is the initial resistance at $1.5558, with 38.2% providing further resistance at $1.5646. Again, as with the euro, until the market settles down, this is a difficult chart to call definitively.
USD/JPY
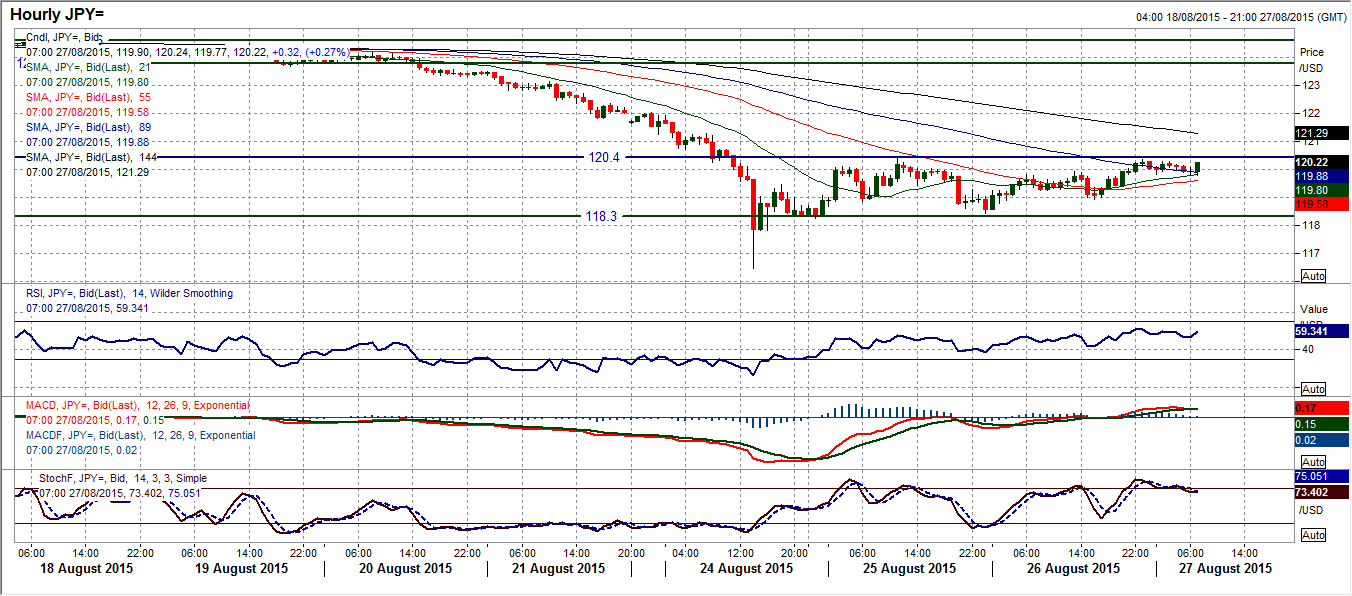
I have been talking about the building of a near term range on Dollar/Yen between the key low at 118.30 and up to the resistance at 120.40. For me, the outlook depends on how this range breaks and subsequently for the time being I am neutral. I am though bordering on turning more positive again (for a number of reasons not the least of which being general market sentiment has improved in the past day or so and this should drive a move away from safer havens such as the yen). Technically, the daily chart shows a Stochastic buy signal that has now been confirmed and the RSI which has also given a crossover buy signal. I look at the hourly chart and it was interesting that the rebound yesterday almost hit the resistance at 120.40 to the pip before falling away. This is clearly the near term barrier and the hourly chart is now unwinding the move. I would look at forming a higher low within the range above 118.90 which could be seen as a near term buying opportunity for further testing of 120.40. Losing 118.90 would re-open pressure on the key support at 118.30.
Gold
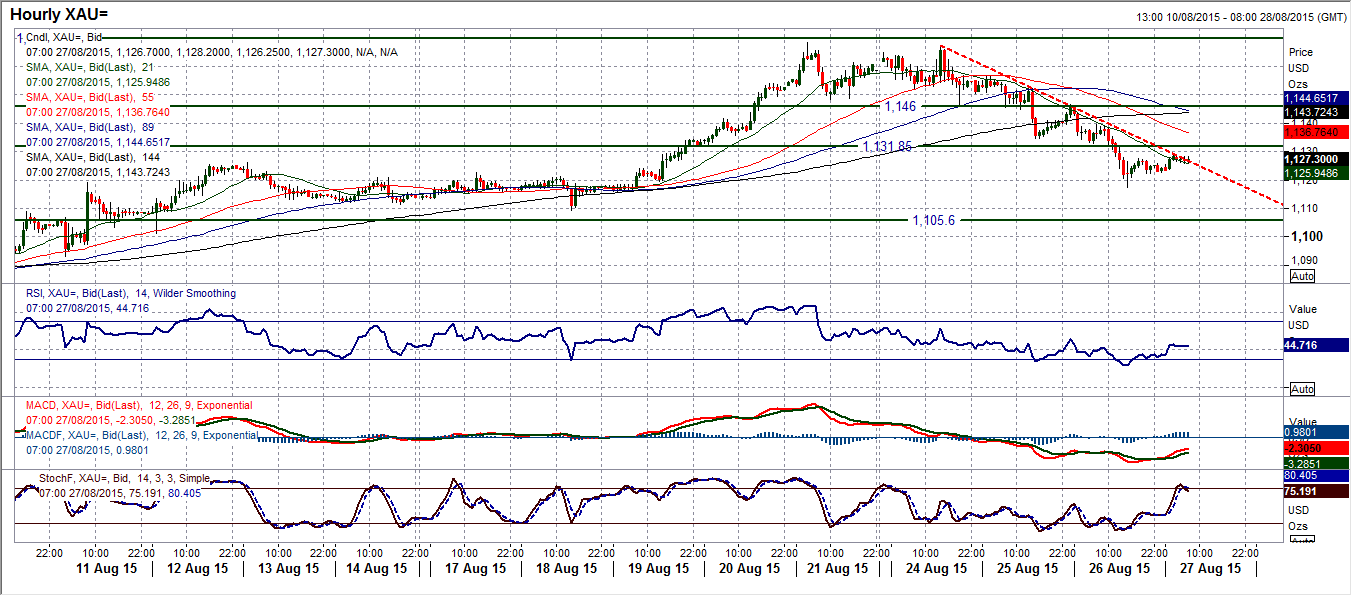
We have seen the corrective move on gold which has more than achieved the target I called at $1128 amidst the move back to a low at $1117.40. The momentum indicators have gone into reverse and are now looking increasingly corrective again. The main concern is the momentum built up on the sliding Stochastics, whilst if the RSI drops below 49 it would also now be rather concerning. The immediate reaction today has been for a slight bounce and now the 3 day downtrend on the intraday hourly chart is being tested. Hourly momentum remains negative and suggests that rallies are a chance to sell still. Immediately I therefore look towards $1131.85, which admittedly has done little to act as the key level that it should be playing (it was a minor consolidation yesterday before being broken decisively). These consolidation moves have been sold into in recent days and I expect this to continue today. A breach of $1117.40 re-opens the key low at $1109.20. Above the minor resistance now just under $1140 would break the corrective move.
WTI Oil
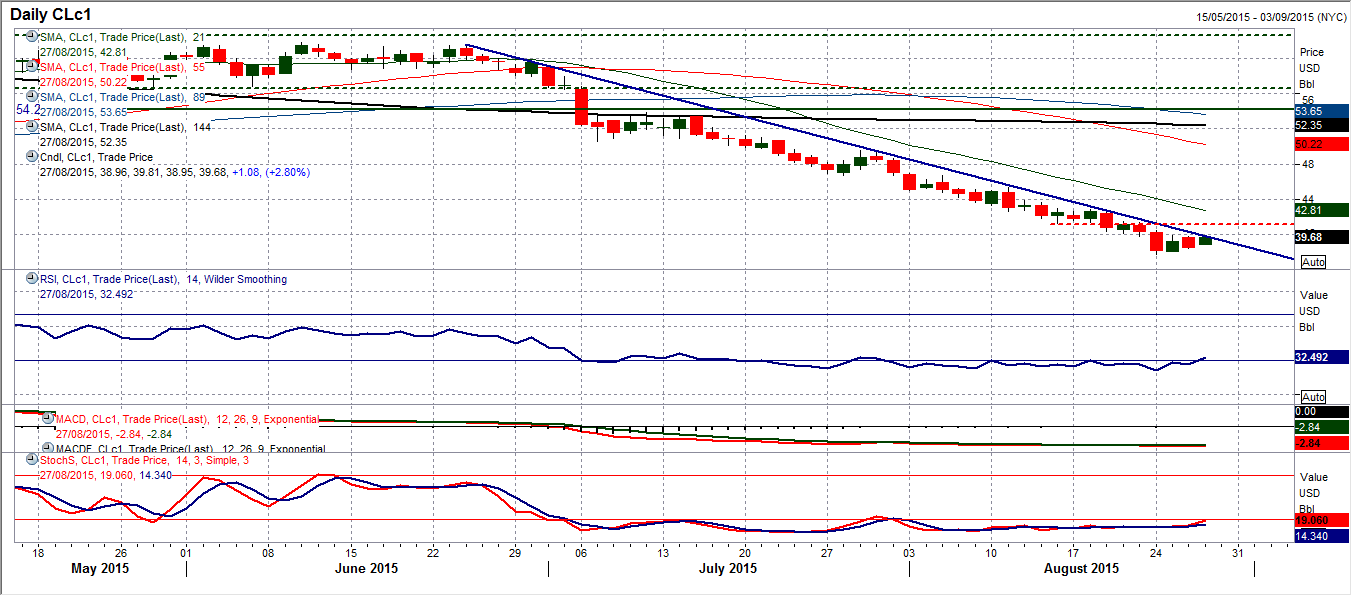
Leaving aside all the noise in the past few days, taking a step will show that the price of WTI remains in its downtrend. Therefore, the tried and trusted strategy is still selling into the rallies. As I said yesterday, remember the trend is your friend, until it ends. Therefore Monday’s low at $37.75 is still the initial support. However, for the first time, the downtrend resistance is now below $40, so anything with a $40 handle from now on would be a trend break. Also the downtrend is now being seriously threatened. The more optimistic trader would point to the fact that the oil price has not made a new low now for two days and has started today with further support. There is still much to be done though for the bulls to get truly interested. I am still looking at the RSI on the daily chart needing to push above 40 to at least look as though the shackles of negative resistance were being rattled. On the hourly chart the RSI pushing and holding above 70 would be a good start in this move. However, I still see the initial resistance band coming in at $40.00/$40.50 which needs to be broken too. Very early green shoots of support, but the improvement needs to continue today.
Note: All information on this page is subject to change. The use of this website constitutes acceptance of our user agreement. Please read our privacy policy and legal disclaimer. Opinions expressed at FXstreet.com are those of the individual authors and do not necessarily represent the opinion of FXstreet.com or its management. Risk Disclosure: Trading foreign exchange on margin carries a high level of risk, and may not be suitable for all investors. The high degree of leverage can work against you as well as for you. Before deciding to invest in foreign exchange you should carefully consider your investment objectives, level of experience, and risk appetite. The possibility exists that you could sustain a loss of some or all of your initial investment and therefore you should not invest money that you cannot afford to lose. You should be aware of all the risks associated with foreign exchange trading, and seek advice from an independent financial advisor if you have any doubts.
Recommended Content
Editors’ Picks
EUR/USD holds positive ground above 1.0700, eyes on German CPI data

EUR/USD trades on a stronger note around 1.0710 during the early Monday. The weaker US Dollar below the 106.00 mark provides some support to the major pair. All eyes will be on the Federal Reserve monetary policy meeting on Wednesday, with no change in rate expected.
USD/JPY recovers 156.00 after testing 155.50 on likely Japanese intervention

USD/JPY has recovered some ground above 156.00 after crashing to 155.00 on what seemed like a Japanese FX intervention. The Yen tumbled in early trades amid news that Japan's PM lost 3 key seats in the by-election. Holiday-thinned trading exaggerates the USD/JPY price action.
Gold tests critical daily support line, will it defend?

Gold price is seeing a negative start to a new week on Monday, having booked a weekly loss. Gold price bears the brunt of resurgent US Dollar (USD) demand and a risk-on market mood amid Japanese holiday-thinned market conditions.
XRP plunges to $0.50, wipes out recent gains as Ripple community debates ETHgate impact

Ripple loses all gains from the past seven days, trading at $0.50 early on Monday. XRP holders have their eyes peeled for the Securities and Exchange Commission filing of opposition brief to Ripple’s motion to strike expert testimony.
Week ahead: FOMC and jobs data in sight

May kicks off with the Federal Open Market Committee meeting and will be one to watch, scheduled to make the airwaves on Wednesday. It’s pretty much a sealed deal for a no-change decision at this week’s meeting.
