Market Overview
It seems as though, having been “Greece” for so long, now it is “China” as sentiment on equities again takes a decline as sharp selling pressure on Shanghai impacts across the Asian markets. After a 6% fall on Tuesday, another 3% decline today is really impacting investors in China and this is knocking on through Asia and now into Europe which has started the day lower. The DAX is back into a key support band and it will be interesting to see if the buyers support it again. This comes as Wall Street suffered a rather drab session, amid mixed housing data (building permits missed expectations whilst housing starts beat) with the S&P 500 falling 0.3%. Greece is though never too far away from the headlines and the fact that the national parliaments within the Eurozone are gradually one by one accepting the third bailout proposals suggests this could be a relatively good news story for a change. The Bundestag in German gets its turn today, and while the dissenting voices have been increasing there is still no suggestion that the vote will pose any problems. The Greeks owe the ECB €3.2bn in bond repayments tomorrow and need the bailout to make the payment.
In forex markets there is an interesting reaction, as the dollar is under a little bit of pressure early on, with the euro especially reacting positively to yesterday’s declines. Quite whether it can sustain a rebound remains to be seen. The big US inflation data could well provide the answers for the near term direction on EUR/USD, whilst the FOMC minutes also loom on the horizon.
So after a quiet morning traders will be focusing on the US. CPI data is released at 1330BST, with the year on year reading expected to stick at +0.2%, however also watch for the core CPI which is expected to stay flat at 1.8%. The weekly oil inventories are at 1530BST and are expected to come in lower again with -2.0m (last week -1.7m). Then all eyes will turn to the Fed meeting minutes from the last FOMC, announced at 1900BST. It will be interesting to see any hawkish hints with the next meeting in September potentially the one where the hike begins.
Chart of the Day – DAX Xetra
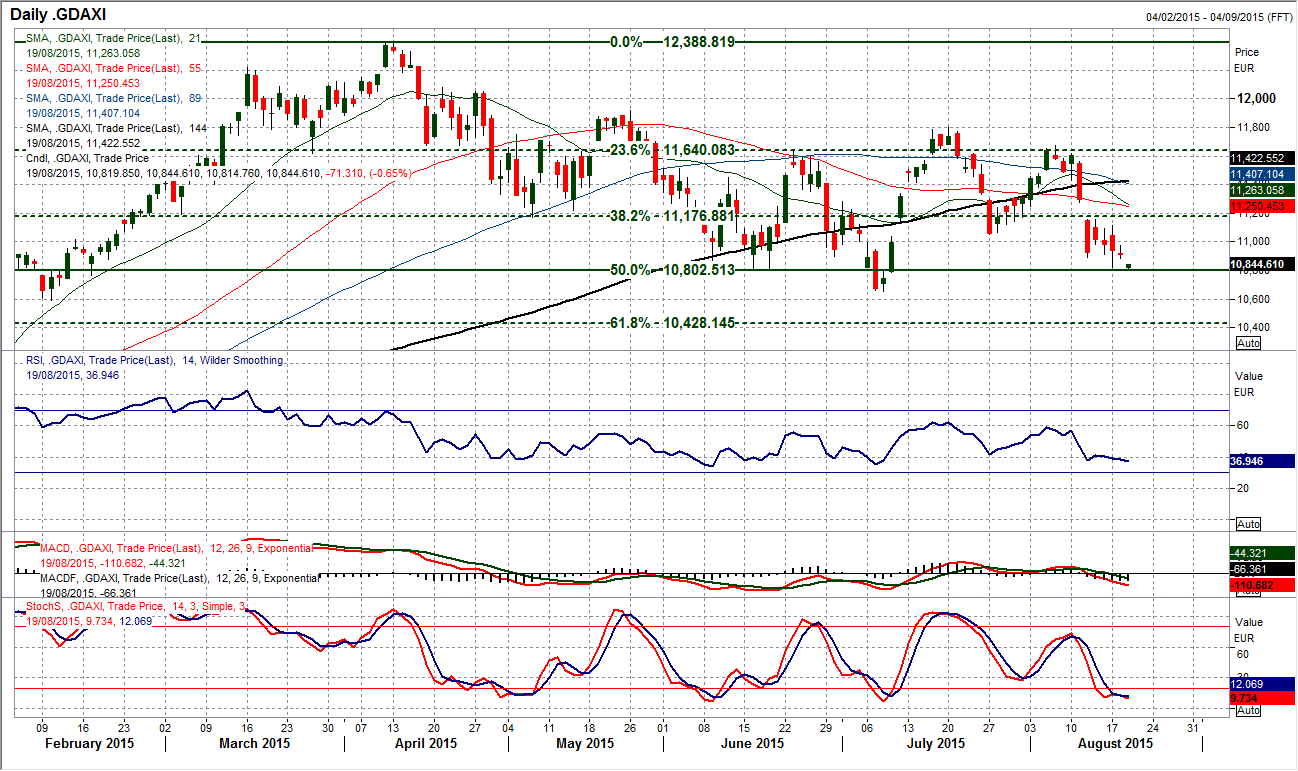
Effectively the DAX has become a range play over the past few months. The range has come in between the support band 10,650/10,800 and up towards the resistance band 11,640/11,920. Within that band, the Fibonacci retracements of the 9216/12,389 December to April rally have become key turning points. The 50% Fib level at 10,802 has become a key basis of support whilst 23.6% Fib at 11,640 is the key resistance. However around the middle of the band we find the 38.2% Fibonacci retracement at 11,177 is also acting as a key consolidation point. Traders will be looking at these levels with interest. The dip towards the range lows suggests that a test of the supports is underway again, but for now is holding. The doji candle yesterday denotes uncertainty with the recent move, and although today’s open is slightly lower it will be interesting to see the reaction to the support around 10,800 again, which is a key level. The daily RSI is also back at levels (around 35-40) where the bulls have supported previously. Is this going to happen again?
EUR/USD
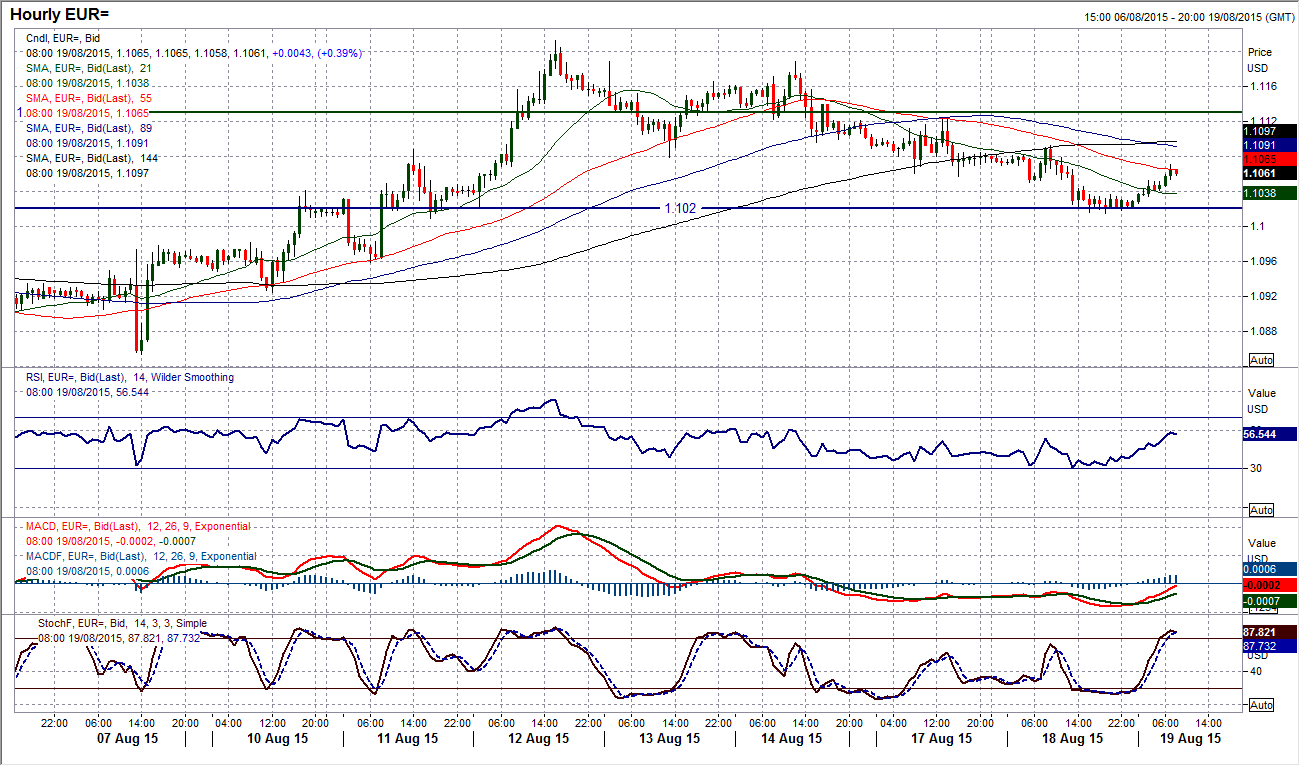
Despite an early rebound today, the euro has been under mounting pressure for the past few days. The closing level towards the day low yesterday reflects a sustained bout of bear control through the day and the fact that this was back below the lower bound of my $1.1050/$1.1100 pivot band is also a concern. The momentum indicators are looking more corrective now with the Stochastics in decline. Quite how the bulls react to this morning’s rally will be telling as to whether the outlook is now a bearish one. The intraday hourly chart shows resistance has now been left at $1.1093, whilst the hourly momentum indicators are unwinding a bearish position but this may now just be seen as a chance to sell. A failure in this old pivot level ($1.1050/$1.1100) around here will constitute a near term sell signal and this would certainly be confirmed should there be a drop back below the support now at $1.1020 which was around yesterday’s low but also a level from the range. Below $1.1020 opens $1.0960. This is becoming an important time now for the near term outlook.
GBP/USD
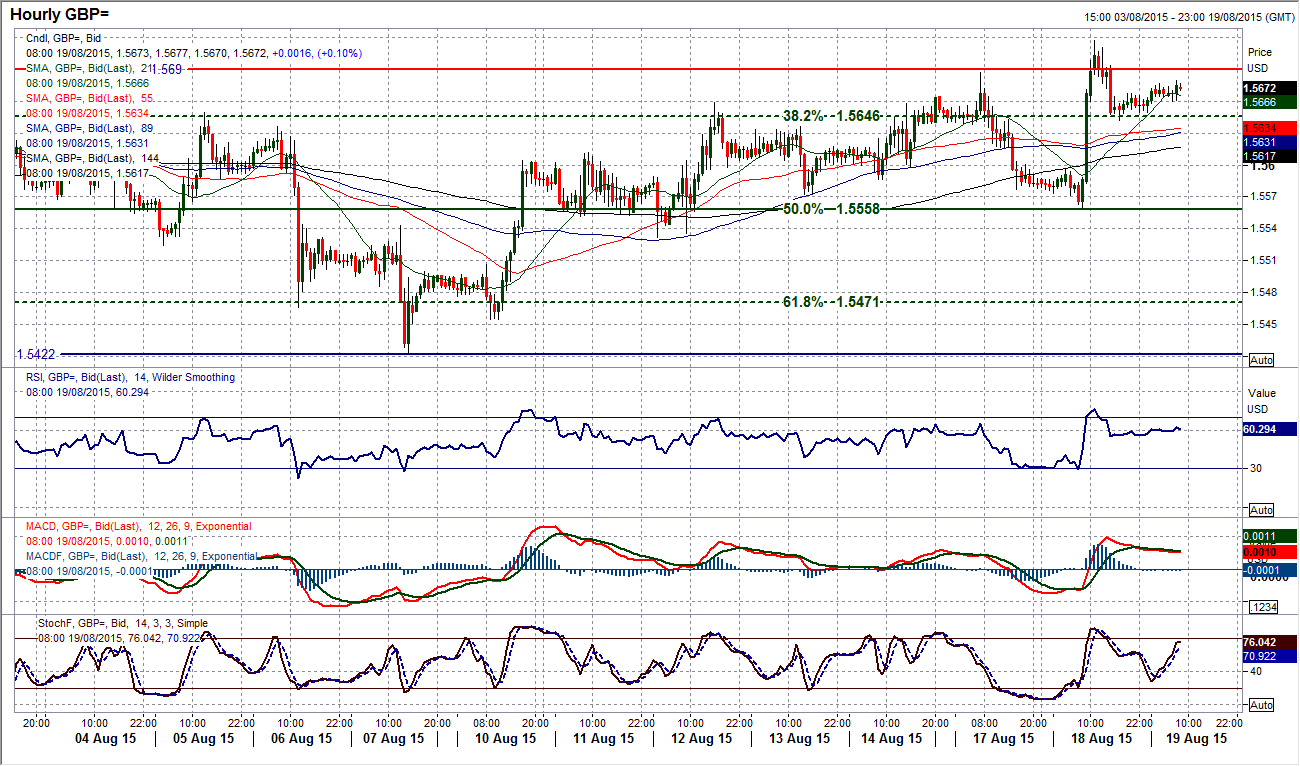
It was close, but Cable could not confirm the breakout of the range that we saw yesterday. An intraday burst above $1.5690 was a 7 week high but the move reversed at $1.5717 before drifting back lower to close at $1.5656. This still constituted a strong bullish candle though which was also an outside day. However it is up to the reaction today now to see if this move can be sustained. The early signs are decent for sterling as a rally is taking hold again, however I would still like to see the momentum indicators stronger than they are to confirm the bulls are achieving that breakout. For example, I would like to see the RSI up above 60. However, the hourly chart certainly shows there is more of a positive slant to Cable now with yesterday’s pullback finding support at the 38.2% Fibonacci retracement at $1.5646 when so many time previously it had been resistance. I am still looking for that closing break above $1.5690 for confirmation of near term bull control for a test of the next resistance levels at the 23.6% Fibonacci level at $1.5754 and then $1.5787. Key near term support below $1.5640 is now the reaction low at $1.5560.
USD/JPY
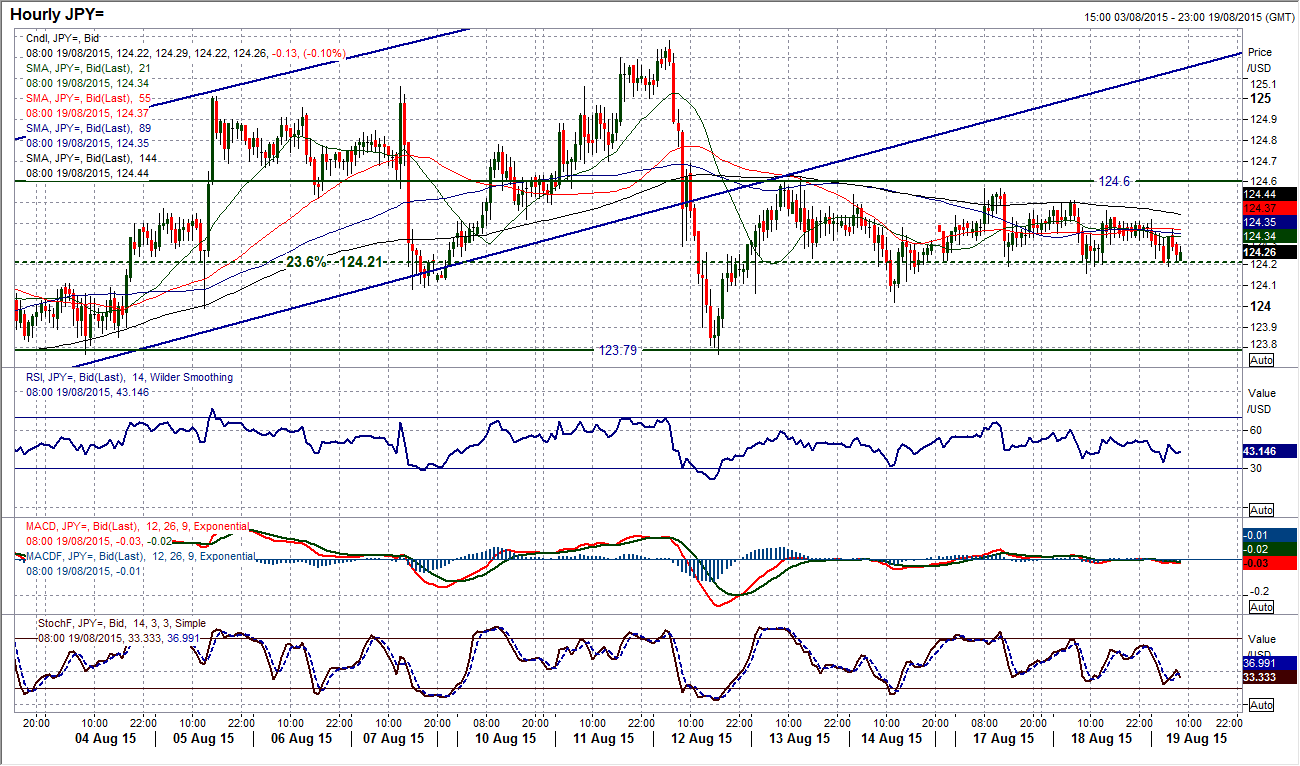
Another Doji candlestick pattern (a second in a row) just shows how indecisive the market is at the moment. That now made it four sessions all contained in a tight 60 pip band between 124.00/124.60. Dollar/Yen will often go through these small phases of directionless trading as we search for a catalyst that will provide the direction. It is a wait and see process as the legacy of some old signals are giving mixed messages. The Stochastics on the daily chart continue to drift lower but aside from that there is no great signal. The hourly chart is almost entirely neutral and despite a slight early weakness in today’s trading will not be anything unless there is a move below 124.20 (the 38.2% Fibonacci retracement level which has been supporting the price now for the past few days. Above 124.60 would re-open the 125.28 high, whilst below 124.00 would not be a confirmed bear move until a breach of the key reaction low at 123.77. We wait for a signal.
Gold
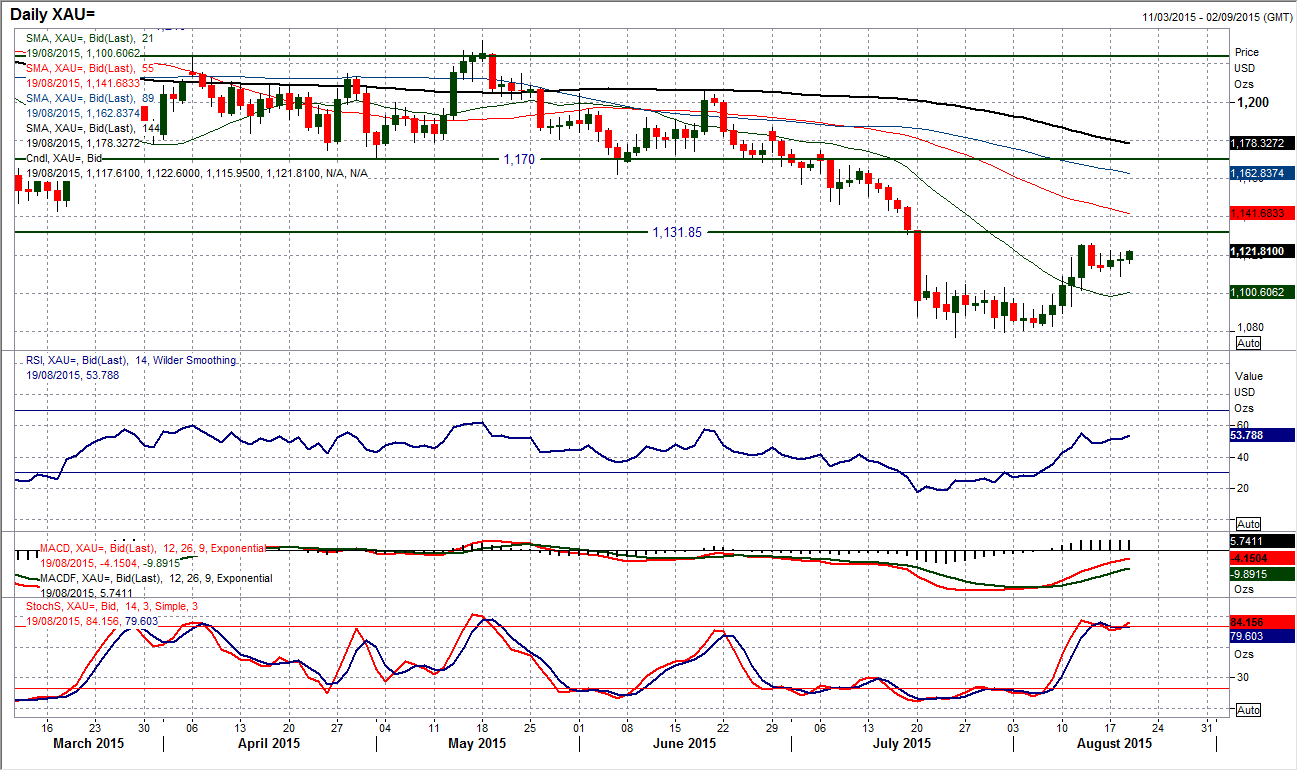
I spoke yesterday about how silver could be a catalyst for a correction on gold. This played out briefly before gold was supported again. The price dipped back to $1109.20 before a rally set in to unwind the move. So we are back into consolidation mode, with the technical indicators again not giving any real signal and the doji candle yesterday (open and close at the same level) denoting uncertainty. The hourly chart reflects the neutral/sideways outlook, whilst the trading in the past hour has seen demand picking up again. There needs to be a sustained move above resistance at $1122.60 to suggest the near term bulls are getting control again However I am still concerned over that breakdown in silver which could be the drag on gold. If the price starts to drift lower today then the selling pressure could mount once more on yesterday’s low at $1109.20 and then $1105.60.
WTI Oil
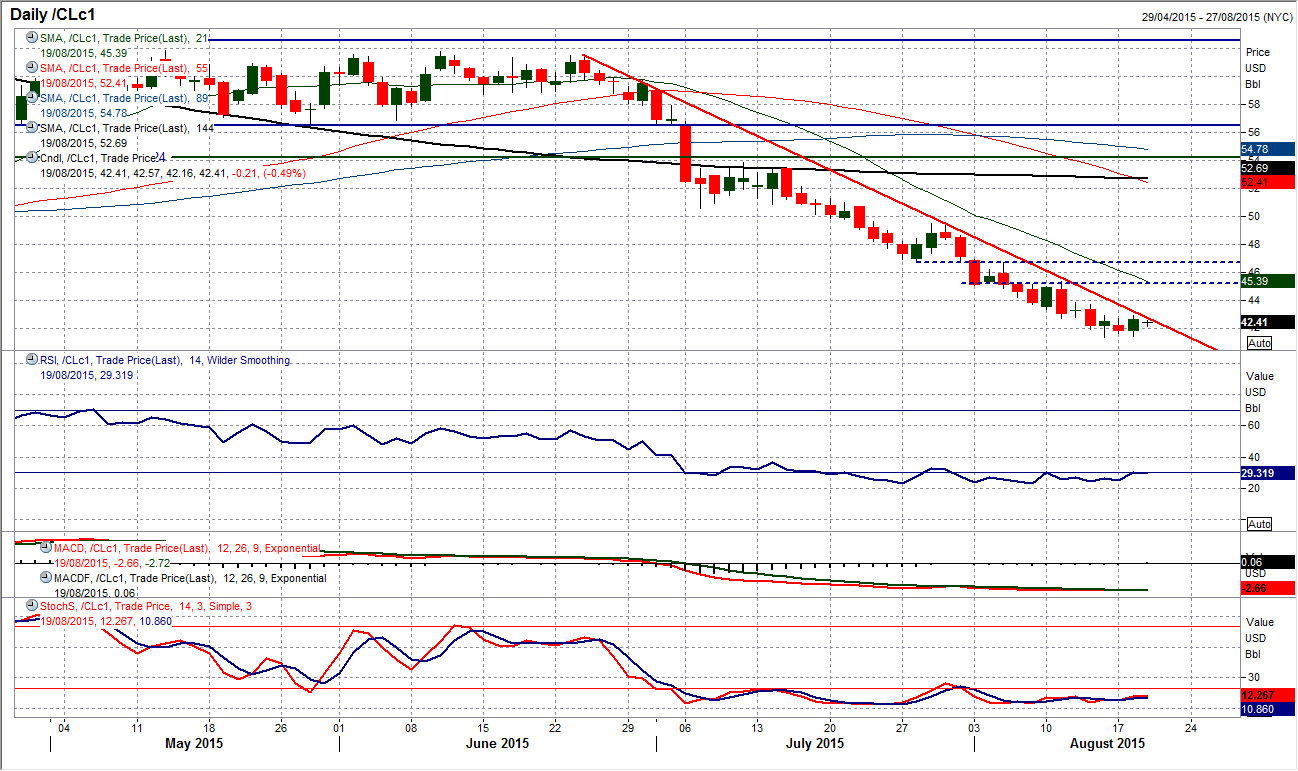
The chart of WTI has been an incredible example of a downtrend which comprises of lower highs and lower lows and could make a happy place in any number of technical analysis text books. The daily chart continues to show consistent selling pressure and a move back towards the downtrend resistance should give us another opportunity to sell. However there is a caveat with the bullish candle (which was almost a bullish key one day reversal) that was posted yesterday which comes as a second positive candle in the last three days. The initial reaction has been lower today but this is one worth keeping an eye on. For now the sequence of lower highs and lower lows continues on the hourly chart but resistance band at $42.75/$43.00 is now being tested. The fact that the hourly MACD lines have improved is also a minor warning for the sellers. The concern I have is that at some stage there will be a rally on WTI and when it goes it could be sizeable (due to the ferocity of the sell-off recently). Just this once, I will stand back and see how this move plays out, it is probably just another rally that will be sold into, but the warning signs are there this time. Support is at $41.43.
Note: All information on this page is subject to change. The use of this website constitutes acceptance of our user agreement. Please read our privacy policy and legal disclaimer. Opinions expressed at FXstreet.com are those of the individual authors and do not necessarily represent the opinion of FXstreet.com or its management. Risk Disclosure: Trading foreign exchange on margin carries a high level of risk, and may not be suitable for all investors. The high degree of leverage can work against you as well as for you. Before deciding to invest in foreign exchange you should carefully consider your investment objectives, level of experience, and risk appetite. The possibility exists that you could sustain a loss of some or all of your initial investment and therefore you should not invest money that you cannot afford to lose. You should be aware of all the risks associated with foreign exchange trading, and seek advice from an independent financial advisor if you have any doubts.
Recommended Content
Editors’ Picks
AUD/USD: Uptrend remains capped by 0.6650

AUD/USD could not sustain the multi-session march north and faltered once again ahead of the 0.6650 region on the back of the strong rebound in the Greenback and the prevailing risk-off mood.
EUR/USD meets a tough barrier around 1.0800

The resurgence of the bid bias in the Greenback weighed on the risk-linked assets and motivated EUR/USD to retreat to the 1.0750 region after another failed attempt to retest the 1.0800 zone.
Gold eases toward $2,310 amid a better market mood

After falling to $2,310 in the early European session, Gold recovered to the $2,310 area in the second half of the day. The benchmark 10-year US Treasury bond yield stays in negative territory below 4.5% and helps XAU/USD find support.
Bitcoin price coils up for 20% climb, Standard Chartered forecasts more gains for BTC

Bitcoin (BTC) price remains devoid of directional bias, trading sideways as part of a horizontal chop. However, this may be short-lived as BTC price action consolidates in a bullish reversal pattern on the one-day time frame.
What does stagflation mean for commodity prices?

What a difference a quarter makes. The Federal Reserve rang in 2024 with a bout of optimism that inflation was coming down to their 2% target. But that optimism has now evaporated as the reality of stickier-than-expected inflation becomes more evident.
