Market Overview
Although in some ways market will now be positioning themselves for what could be a historic announcement from the ECB on Thursday, there is still a level of volatility that continues. The oil price continues to fly around and is failing to settle down (falling again after the IMF cut is global growth projections). The reaction suggests there is still considerable concern over a lack of global demand. Wall Street also endured a hectic session with gains giving way to sharp losses only to settle the day mildly higher. Asian markets were also volatile again overnight, but with gains seen across most markets in the region, the Japanese Nikkei 225 was lower as the Yen strengthened sharply against the dollar after the Bank of Japan continued its stimulus programme and but cut its core forecast for CPI. European markets have opened with mild gains as traders prepare for the ECB tomorrow.
In forex trading, after making slight gains yesterday, the dollar is under a little pressure against the major currencies today, with even the euro achieving a minor rebound. Traders will be looking out for the UK unemployment data today which is expected to show the headline rate falling to 5.9%, but also to show average earnings increasing to 1.7%. The Bank of England meeting minutes are unlikely to show much change on what has become the usual 7-2 split in favour of keeping rates flat. The US Building Permits and Housing Starts are at 1330GMT and are both expected to increase slightly to 1.06m (permits) and 1.04m (starts). The Bank of Canada is expected to keep rates flat at 1.0% at 1500GMT.
Chart of the Day – Silver
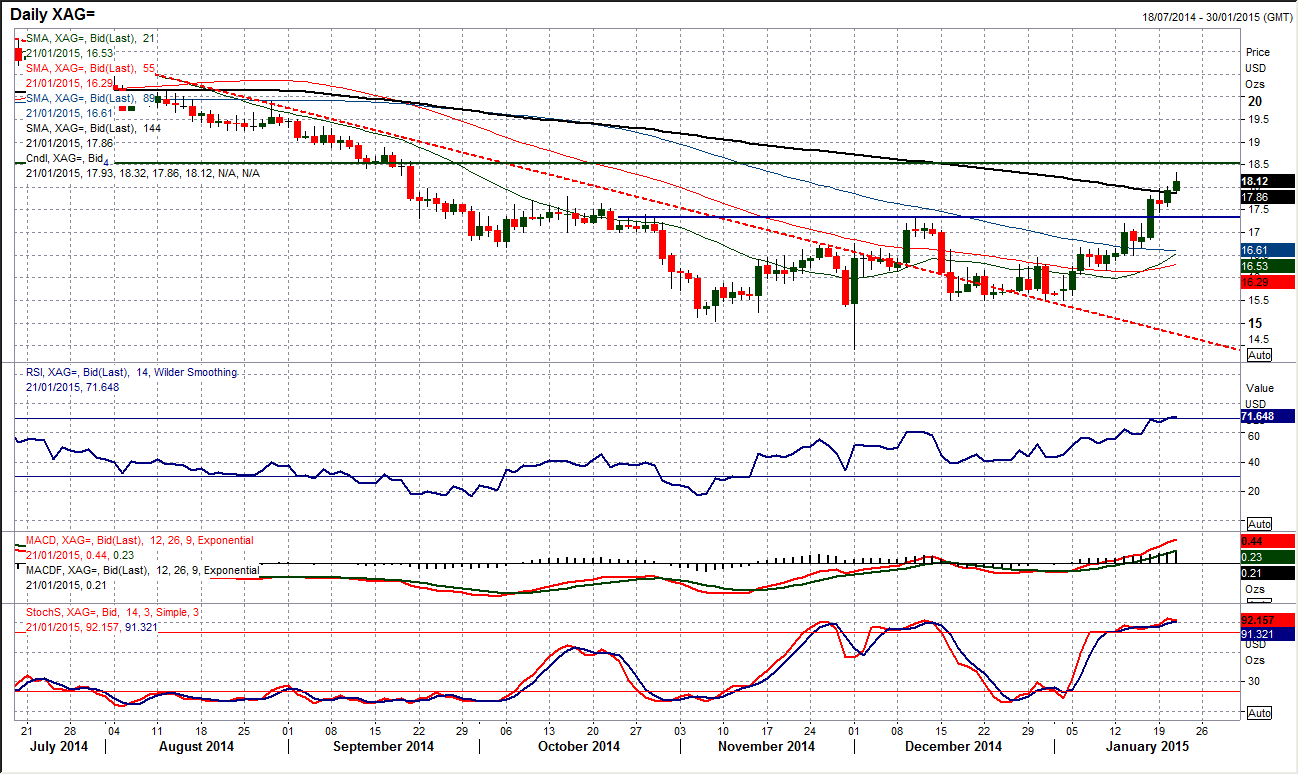
Just as gold has been pushing strongly higher, we are now in a position where silver is finally looking to have broken the shackles too. The move on Friday above $17.33 was a key moment as it arguably completed a small base pattern which gives a conservative target of $19.10. There has also now been the added confirmation of the move above the key October reaction high at $17.80. Momentum indicators are increasingly strong with the RSI and MACD lines at a 6 month high and are now suggesting that corrections should be seen as a chance to buy. The next key hurdle for silver is the resistance of the old critical floor at $18.54 and if this can be overcome successfully the bulls should gain significant confidence. The intraday hourly chart shows a good band of support now between $17.45/$18.00.
EUR/USD
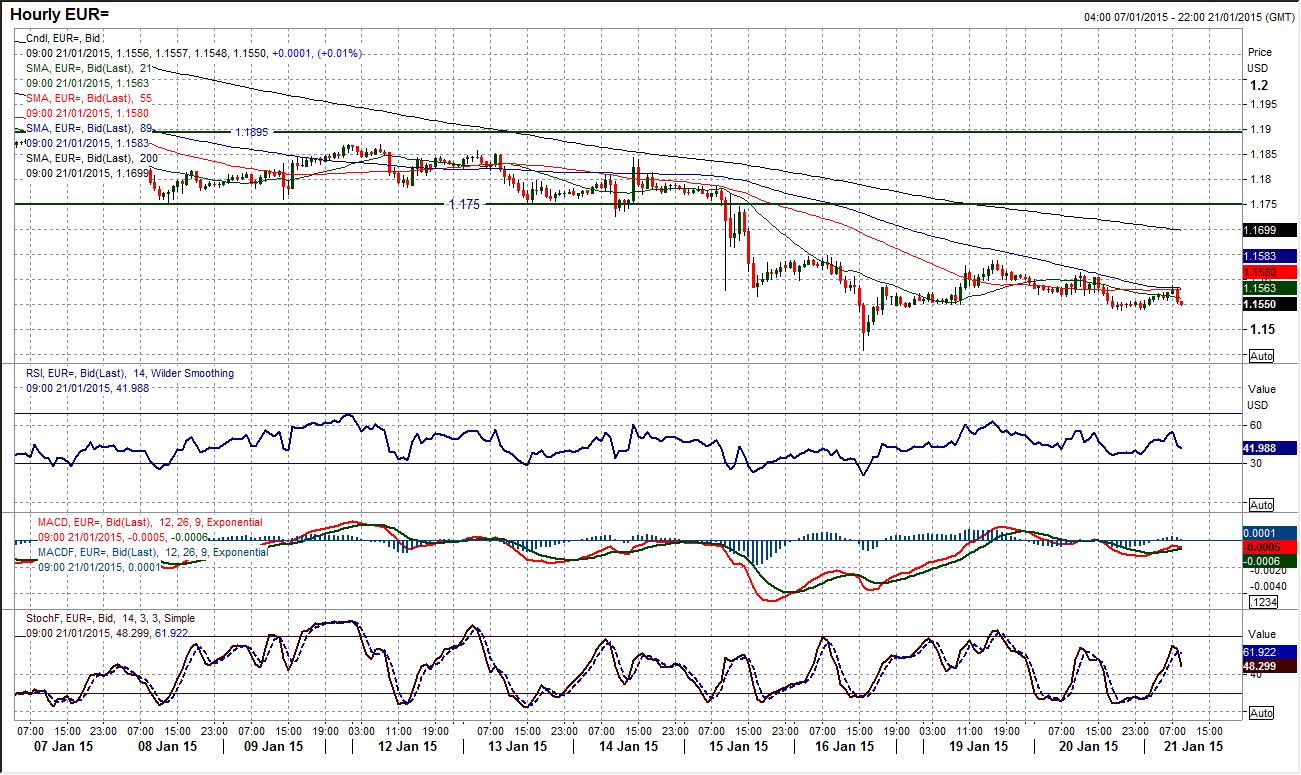
After seeing the selling pressure accelerate last week the euro has settled into a bit more of a consolidation in the early part of this week. This could well be due to the prospect of a huge announcement from the ECB tomorrow on monetary policy (whatever the ECB does now it seems likely that there will be a significantly volatile reaction on EUR/USD).Technically the euro remains under consistent selling pressure and this consolidation is similar to what we have seen on numerous times over the past few weeks where the bears always win out in the end. The momentum indicators (RSI and Stochastics) are gradually unwinding oversold positions as the consolidation has gone on and this for me is a concern as it is renewing the downside potential for the next bear move. The intraday hourly chart shows that Monday’s rebound high at $1.1640 again coincided with an old support and is the initial barrier, whilst the key near term resistance and pivot level comes in at $1.1750. The next longer term support levels below $1.1460 come in between $1.1100/$1.1200.
GBP/USD
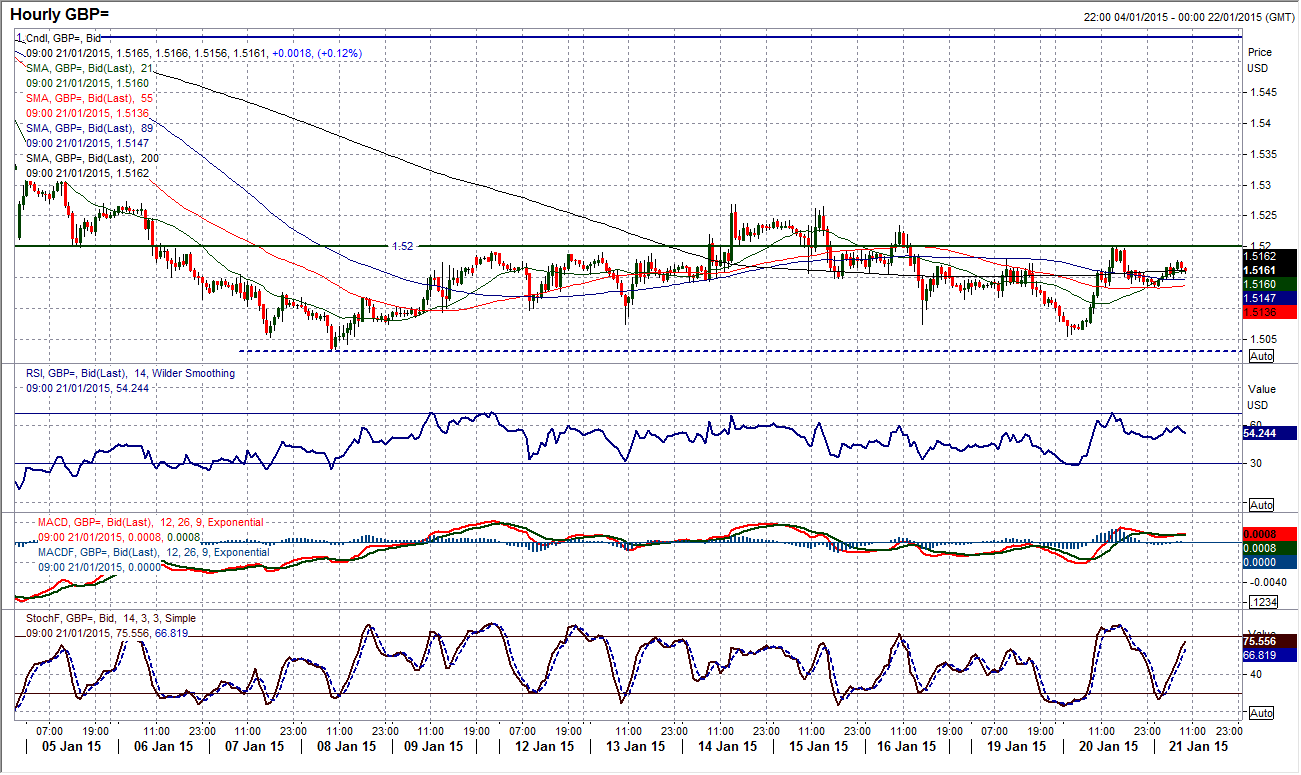
The long term technical outlook on Cable remains weak and even though there has been an element of support which is retained above $1.5032, there is still the realisation that this is merely a consolidation within the long downtrend and that momentum indicators are simply unwinding to renew downside potential. That is not to say that there is not any room for further rebound. The RSI is unwinding but is currently around 37 and tends to reach the mid-40s during these consolidation periods. The 21 day moving average which has been a good basis of resistance too is well over 100 pips to the upside still (although is now rapidly falling). Looking at the intraday hourly chart shows that the past two and a half weeks have been characterised by a band of sideways trading between $1.5032 and $1.5270 so there are still plenty of opportunities for short term trading. The current outlook is neutral (sideways moving averages and momentum indicators) with a slight positive bias that could see the resistance around $1.5200 tested. The configuration of the hourly RSI suggests this is a good range play for now.
USD/JPY
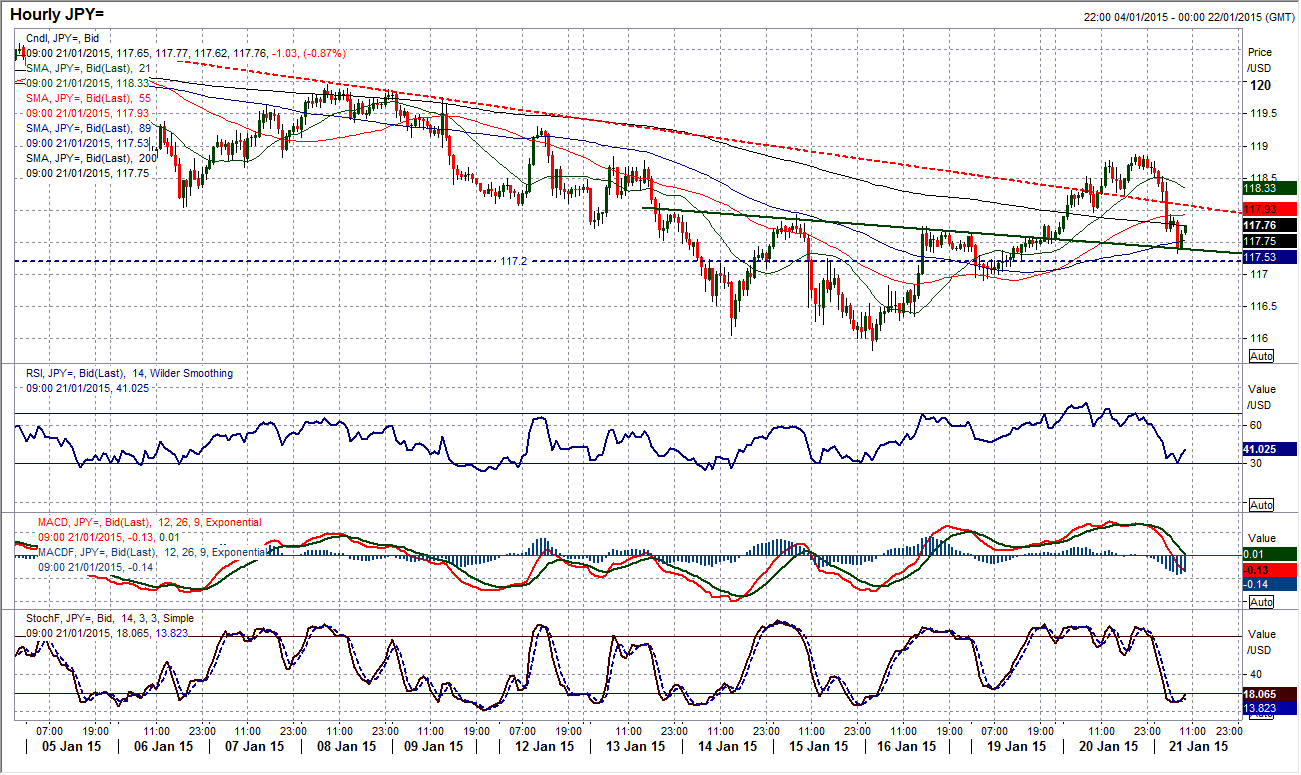
The medium term outlook continues to look for a decisive pattern as the momentum indicators have gradually become increasingly neutral. With the recent support band building around 116, the rebound seems to have failed to push back above the resistance band 119/120 as the wind has been taken out of the recovery overnight. The intraday hourly chart shows us more of the current outlook as the rally on Tuesday managed to break the recent two week downtrend and also complete a small base pattern above 118. However the overnight correction has now questioned the base formation and if the support between 117.50/117.75 fails to hold then the recovery will be in jeopardy. A loss of support at 117 would re-open a test of 116.
Gold
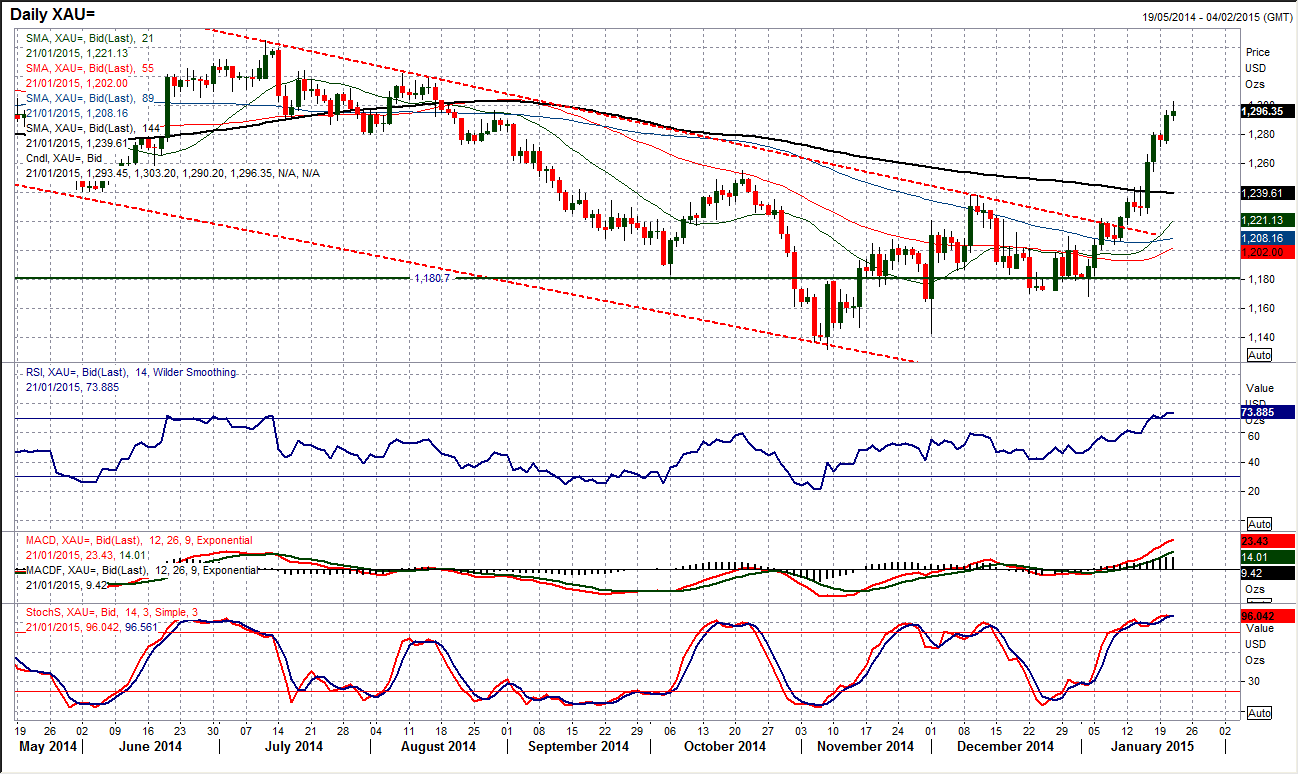
The incredible run higher on gold in the first few weeks of January has seen a move above $1300 for the first time since mid-August. There is also strength to the momentum which suggests that there is more yet to come as RSI, MAD and Stochastics are all rising strongly. The next resistance comes in at $1322.60, which is the August 2014 high. The intraday hourly chart reflects a very strong sequence of stepped advance with intraday consolidation consistently bought into. I especially like the configuration of the hourly RSI which consistently has found support around 40 and latterly around 50 during this time. Look to use any period of consolidation as a chance to buy. There is a good band of support $1271/$1284 with which to work from near term.
WTI Oil
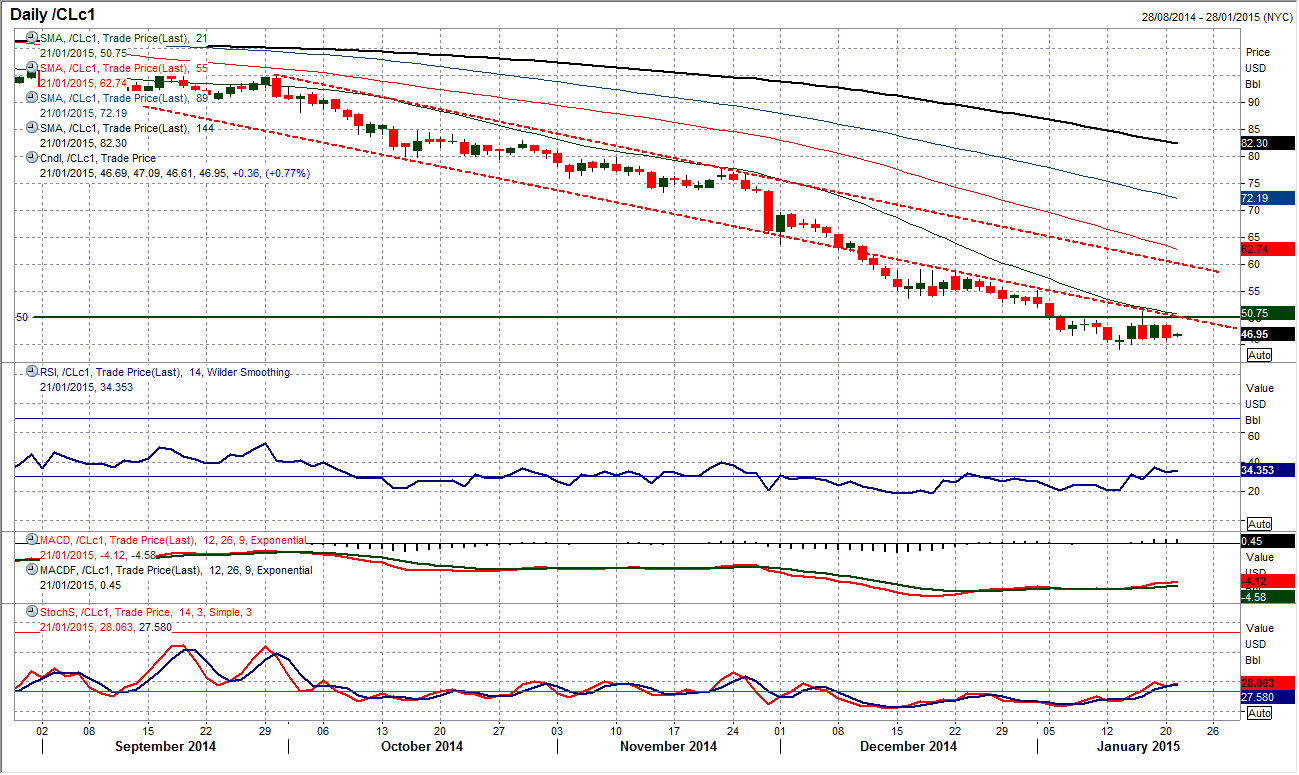
The volatility continues as the US returned from Martin Luther King national holiday yesterday for the WTI price to play catch up on the declines seen on Brent Crude on Monday. There is clearly still a sense of uncertainty surrounding the recent consolidation. Whilst the support at $44.21 has become a near term floor, the bulls are unable to gain any real traction yet as momentum indicators drift higher without any sign of recovery on the daily chart. After yesterday’s decline, the near term resistance comes in at $48.87, however there is increasing pressure on support around $46 which comes above the $45 support. This still looks just to be a consolidation within the bear market. Technical indicators are still suggesting that the bears remain in control and this should ultimately end up with further pressure on the low at $44.21. A breach would re-open further downside. The next level would be the support around $40.
Note: All information on this page is subject to change. The use of this website constitutes acceptance of our user agreement. Please read our privacy policy and legal disclaimer. Opinions expressed at FXstreet.com are those of the individual authors and do not necessarily represent the opinion of FXstreet.com or its management. Risk Disclosure: Trading foreign exchange on margin carries a high level of risk, and may not be suitable for all investors. The high degree of leverage can work against you as well as for you. Before deciding to invest in foreign exchange you should carefully consider your investment objectives, level of experience, and risk appetite. The possibility exists that you could sustain a loss of some or all of your initial investment and therefore you should not invest money that you cannot afford to lose. You should be aware of all the risks associated with foreign exchange trading, and seek advice from an independent financial advisor if you have any doubts.
Recommended Content
Editors’ Picks
AUD/USD retargets the 0.6600 barrier and above

AUD/USD extended its positive streak for the sixth session in a row at the beginning of the week, managing to retest the transitory 100-day SMA near 0.6580 on the back of the solid performance of the commodity complex.
EUR/USD finds support near 1.0720 after slow grind on Monday

EUR/USD jostled on Monday, settling near 1.0720 after churning in a tight but lopsided range as markets settled in for the wait US Fed outing. Investors broadly expect US rates to hold steady this week, but traders will look for an uptick in Fed guidance for when rate cuts could be coming.
Gold advances for a third consecutive day

Gold fluctuates in a relatively tight channel above $2,330 on Monday. The benchmark 10-year US Treasury bond yield corrects lower and helps XAU/USD limit its losses ahead of this week's key Fed policy meeting.
Will Bitcoin ignore major macro market developments this week?

Bitcoin price will be an interesting watch this week, with increased volatility expected amid crucial events lined up in the macro market. On Tuesday, Hong Kong will be debuting its BTC and ETH ETFs while the next day will see FOMC minutes make headlines.
Gearing up for a busy week: It typically doesn’t get any bigger than this

Attention this week is fixated on the Federal Reserve's policy announcement scheduled for Wednesday. While the US central bank is widely expected to remain on hold, traders will be eager to discern any signals from the Fed regarding the possibility of future interest-rate cuts.
