EUR/USD Current Price: 1.1565
View Live Chart for the EUR/USD
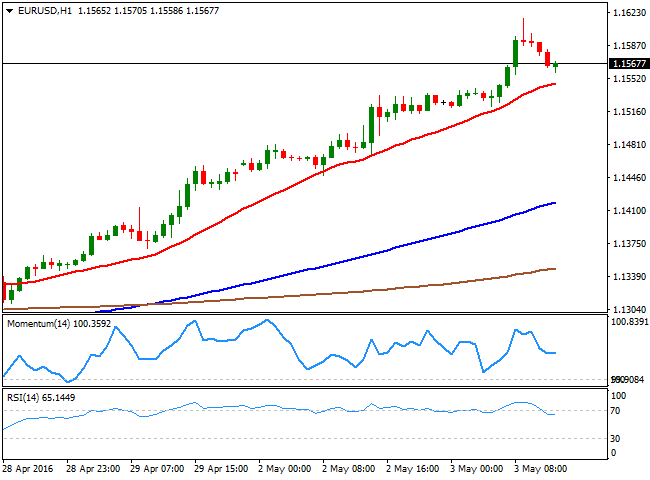
The dollar plummeted to fresh year lows against most of its major rivals, exception made by commodity related currencies, down on different reasons. The Canadian dollar is being affected by a sharp decline in oil prices, while the AUD fell after the RBA surprised by cutting rates by 0.25% to 1.75%. The EUR/USD pair soared to a fresh 2016 high of 1.1564 following London's opening, as stocks plummeted all across Europe. Majors are being driven mostly on sentiment, as the common currency retreated once stocks pared losses.
In the macroeconomic front, data coming from the EU was pretty encouraging, as in March, industrial producer prices rose by 0.3% compared to February, when they slumped 0.7%. Compared to a year before, prices fell less than expected, -4.2% matching February's reading.
The EUR/USD pair fell around 50 pips, but it was just enough to correct overbought readings in the short term, but not to erase the bullish trend, as in the 1 hour chart, the price remains well above a bullish 20 SMA, whilst the technical indicators have corrected extreme overbought readings and are now aiming to resume their advances. In the 4 hours chart, the technical indicators have turned slightly lower, but remain in extreme overbought territory, whilst the price stands far above a sharply bullish 20 SMA, also indicating that bulls maintain the lead, despite any possible intraday downside corrective move.
Support levels: 1.1545 1.1500 1.1460
Resistance levels: 1.1565 1.1610 1.1655
GBP/USD Current price: 1.4622
View Live Chart for the GBP/USD
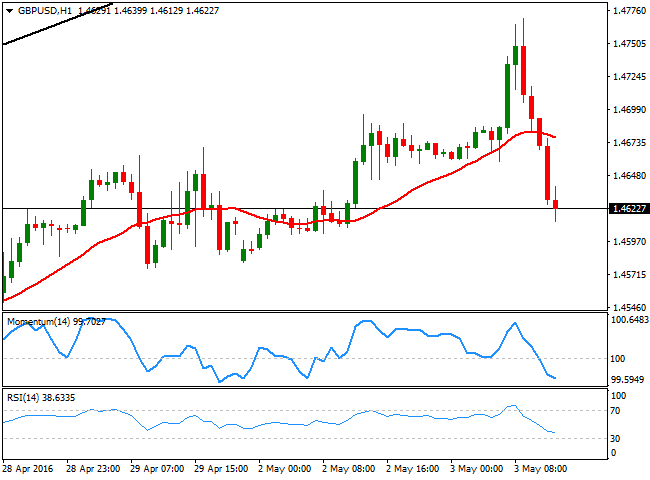
The GBP/USD pair traded as high as 1.4769 before plummeting to a fresh daily low of 1.4612 following the release of the UK Markit manufacturing PMI, down to 49.2 in March, its lowest in three years. The pair remains near the mentioned low, with scope to extend its decline below the 1.4600 level, as in the 1 hour chart, the technical indicators present strong bearish slopes within negative territory, whilst the price broke below its 20 SMA, now turning south around 1.4680. In the 4 hours chart, the price is currently breaking below its 20 SMA, whilst the technical indicators have accelerated their declines, and are both pointing to break below their mid-lines, also indicating the pair can extend its decline.
Support levels: 1.4605 1.4570 1.4530
Resistance levels: 1.4640 1.4680 1.4710
USD/JPY Current price: 105.95
View Live Chart for the USD/JPY
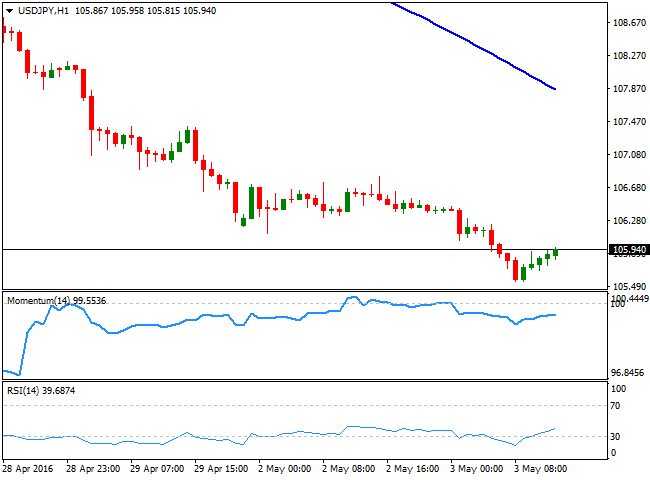
Testing BOJ's patient. The USD/JPY pair plummeted to a fresh multi-month low of 105.54, as investors seems now determinate to test BOJ's patient. The continued decline in the pair has increased the risk of a Bank of Japan intervention, but they have lost their chance during the last meeting, and any upward reaction to an intervention could be quickly reverted in the pair. In the meantime, the risk remains towards the downside, and market talks are now pointing for a test of the major psychological level of 100.00. Short term, the 1 hour chart shows that the technical indicators have corrected extreme oversold readings, but remain well below their mid-lines, whilst the 100 DMA accelerated its decline but remains far above the current level. In the 4 hours chart, the RSI indicator remains within oversold territory, while the Momentum indicator aims higher below its 100 level. Upcoming moves, however, will depend on Wall Street's tone, as if US stocks fall, the pair may well resume its decline towards fresh lows below the 105.00 level.
Support levels: 105.55 105.20 104.70
Resistance levels: 106.20 106.60 107.00
AUD/USD Current price: 0.7525
View Live Chart for the AUD/USD
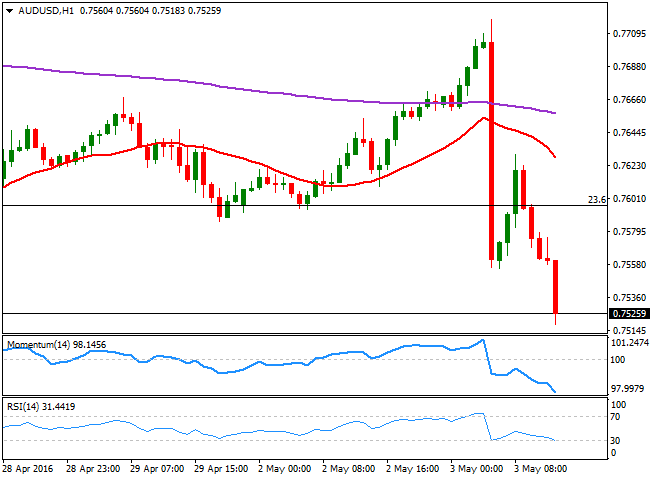
The AUD/USD pair trades at fresh 4-week lows, with the Aussie pressured by the surprise decision taken by the RBA, as the Central Bank cut the key cash rates by 25 bps to a record low of 1.75% at its policy meeting this Tuesday, in a attempt to fight falling inflation. Glen Stevens offered a quite dovish statement with downbeat economic prospects, and concerns over Aussie strength. The technical picture favors additional declines, as in the 1 hour chart, the technical indicators have accelerated their declines and are about to break into oversold territory, while he price is also below its moving averages and the 0.7600 level, the 23.6% retracement of this year rally. In the 4 hours chart, technical readings are also biased lower, supporting a test of 0.7450, the 38.2% retracement of the mentioned rally during the upcoming sessions.
Support levels: 0.7510 0.7480 0.7450
Resistance levels: 0.7560 0.7600 0.7640
Information on these pages contains forward-looking statements that involve risks and uncertainties. Markets and instruments profiled on this page are for informational purposes only and should not in any way come across as a recommendation to buy or sell in these assets. You should do your own thorough research before making any investment decisions. FXStreet does not in any way guarantee that this information is free from mistakes, errors, or material misstatements. It also does not guarantee that this information is of a timely nature. Investing in Open Markets involves a great deal of risk, including the loss of all or a portion of your investment, as well as emotional distress. All risks, losses and costs associated with investing, including total loss of principal, are your responsibility. The views and opinions expressed in this article are those of the authors and do not necessarily reflect the official policy or position of FXStreet nor its advertisers. The author will not be held responsible for information that is found at the end of links posted on this page.
If not otherwise explicitly mentioned in the body of the article, at the time of writing, the author has no position in any stock mentioned in this article and no business relationship with any company mentioned. The author has not received compensation for writing this article, other than from FXStreet.
FXStreet and the author do not provide personalized recommendations. The author makes no representations as to the accuracy, completeness, or suitability of this information. FXStreet and the author will not be liable for any errors, omissions or any losses, injuries or damages arising from this information and its display or use. Errors and omissions excepted.
The author and FXStreet are not registered investment advisors and nothing in this article is intended to be investment advice.
Recommended Content
Editors’ Picks
EUR/USD hovers near 1.0700 even as USD struggles ahead of data

EUR/USD has erased gains to trade flat near 1.0700 in the European session on Thursday. The pair comes under pressure even as the US Dollar struggles, in the aftermath of the Fed policy announcements and ahead of more US employment data.
GBP/USD turns south toward 1.2500, US data eyed

GBP/USD is consolidating the rebound above 1.2500 in European trading on Thursday. The pair struggles, despite the US Dollar weakness on dovish Fed signals. A mixed market mood caps the GBP/USD upside ahead of mid-tier US data.
Gold price pulls back as market sentiment improves

The Gold price is trading in the $2,310s on Thursday after retracing about three-tenths of a percent on reduced safe-haven demand. Market sentiment is overall positive as Asian stocks on balance closed higher and Oil prices hover at seven-week lows.
Top 3 Price Prediction BTC, ETH, XRP: Altcoins to pump once BTC bottoms out, slow grind up for now

Bitcoin reclaiming above $59,200 would hint that BTC has already bottomed out, setting the tone for a run north. Ethereum holding above $2,900 keeps a bullish reversal pattern viable despite falling momentum. Ripple coils up for a move north as XRP bulls defend $0.5000.
Happy Apple day

Apple is due to report Q1 results today after the bell. Expectations are soft given that Apple’s Chinese business got a major hit in Q1 as competitors increased their market share against the giant Apple.