EUR/USD Current price: 1.0747
View Live Chart for the EUR/USD
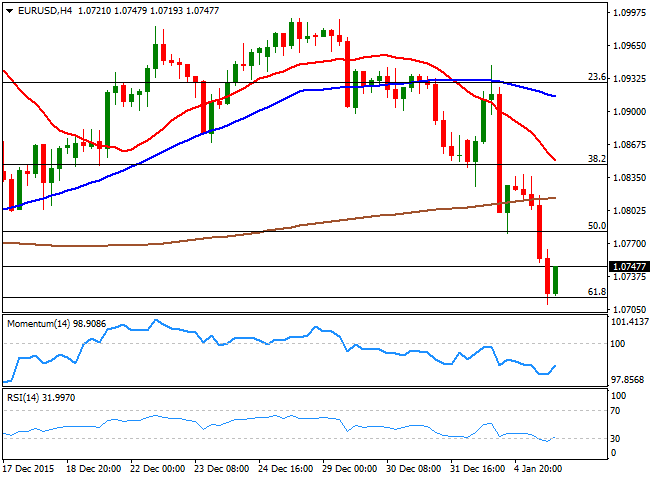
The American dollar rallied against most of its major rivals this Tuesday, with the EUR/USD pair falling down to 1.0710 before finally bouncing some. Despite tension in the Middle East escalated this Tuesday, Chinese stocks ended the day with quite limited losses, leading to an improved market sentiment. News coming from Europe were pretty disappointing, as an initial estimate shows that the EU annual inflation is expected to be 0.2% in December 2015, stable compared to November 2015, while the core figure is expected to retreat down to 0.8% from the previous 0.9%. The pair traded with a negative tone ahead of the news, accelerating its decline afterwards and breaking through the 1.0800 level.
Holding near its daily lo, the downward potential is still strong in the short term, as in the 1 hour chart, the price remains well below a bearish 20 SMA, whilst the technical indicators have resumed their declines after correcting extreme oversold readings. In the 4 hours chart, the technical indicators are posting tepid bounces from extreme oversold readings, but the price has declined further below its moving averages. The daily low converges with the 61.8% retracement of the December rally, which means a break below it is no required to confirm additional declines, eyeing a 100% retracement towards the 1.0500 level later this week.
Support levels: 1.0710 1.0660 1.0625
Resistance levels: 1.0780 1.0810 1.0845
EUR/JPY Current price: 127.70
View Live Chart for the EUR/JPY
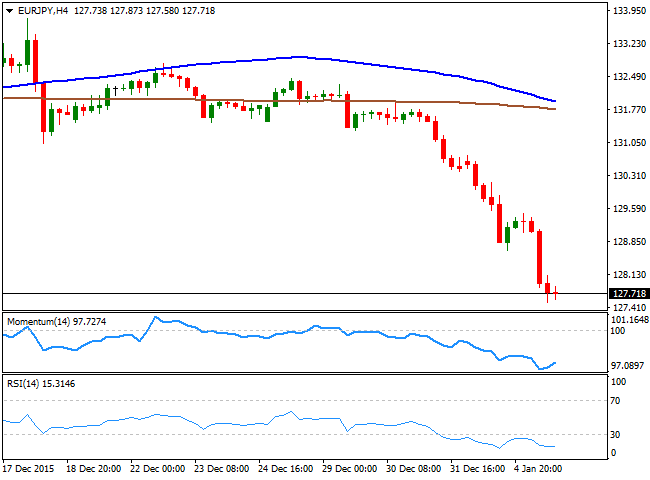
The Japanese yen held to its recent strength, resulting in an almost 200 pips decline in the EUR/JPY towards levels not seen since mid April this year. The pair has lost over 400 pips during the last three trading days and, despite oversold, there are no technical signs that a bottom has been reached, as the daily chart shows that the technical indicators maintain their sharp bearish slopes, with the RSI indicator heading south around 22. Shorter term, the 1 hour chart shows that the technical indicators have corrected some of their extreme oversold readings before turning back south in extreme territory, while the price continues accelerating further below its 100 and 200 SMAs. In the 4 hours chart, the technical indicators have lost their bearish momentum, but hold well into oversold territory, while the 100 SMA is about to cross below the 200 SMA, both well above the current level, in line with a continued decline.
Support levels: 127.50 127.15 126.60
Resistance levels: 128.20 128.65 129.10
GBP/USD Current price: 1.4667
View Live Chart for the GBP/USD
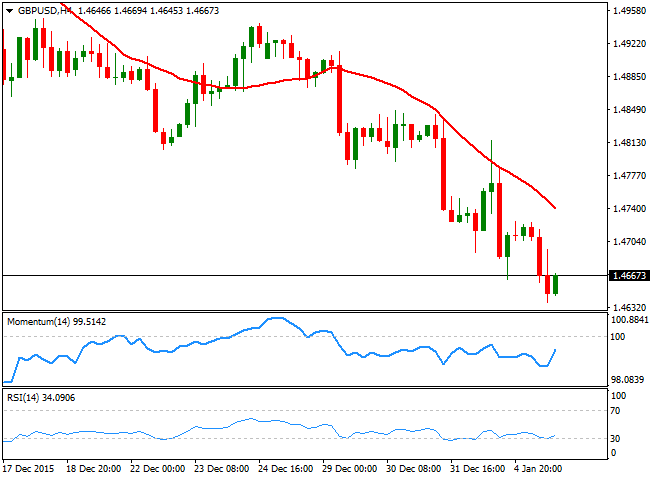
The British Pound extended its decline against the greenback, reaching a fresh 8-month low at 1.4637 during the US session, having barely bounced from the level afterwards. The negative sentiment towards the GBP continues, despite Tuesday data beat expectations as the UK December construction PMI resulted at 57.8 against the previous 55.3. Anyway, the pair maintains the bearish tone that dominates the pair for over two months already, and will likely continue falling. Technically, the 1 hour chart, shows that the price develops below a bearish 20 SMA, currently around 1.4690, whilst the technical indicators have turned flat well below their mid-lines, following a limited upward corrective move. In the 4 hours chart, the price is also well below a bearish 20 SMA, although the technical indicators are bouncing from oversold territory, rather following the ongoing bounce in the price than suggesting further gains are under way.
Support levels: 1.4635 1.4590 1.4550
Resistance levels: 1.4690 1.4725 1.4755
USD/JPY Current price: 118.92
View Live Chart for the USD/JPY
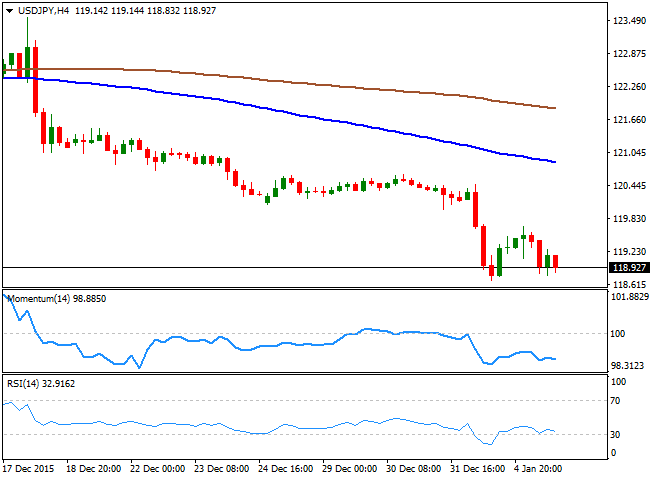
The USD/JPY pair corrected higher at the beginning of the day, advancing up to the 119.60 region before selling interest sent it back south. Although the dollar traded broadly higher, the pair closed in the red for a second day in-a-row, having, however, held above Monday's high of 118.69 the immediate support. Heading into the Asian session around the 119.00 level, the bearish bias is still favored as market players are quite sensitive and any spark of risk aversion will automatically send them towards the JPY. From a short term technical perspective, the downside is also favored, as in the 1 hour chart, the technical indicators have stabilized well below their mid-lines, whilst the moving averages have extended their declines far above the current level. In the 4 hours chart, the technical indicators are turning south after erasing their extreme oversold readings, supporting a downward extension towards 118.00 on a break below 118.70.
Support levels: 118.70 118.35 118.00
Resistance levels: 119.20 119.60 120.00
AUD/USD Current price: 0.7147
View Live Chart for the AUD/USD
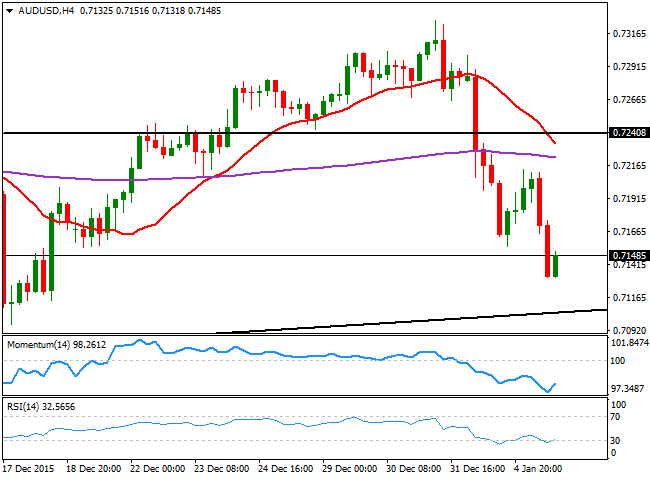
The Australian dollar remained under pressure this Tuesday, down to 0.7131 against the greenback, the lowest for the pair since December 18th. The Aussie could not recover from the early week sell-off triggered by speculation of further economic slowdown in China, and is now technically bearish against 0.7240, a strong static resistance level. The country will release its AiG Performance of Services Index for December during the upcoming hours, which latest reading stands at 48.2. If the report results below such level, the AUD/USD will likely extend its decline towards the 0.7100 level, where a daily ascendant trend line should halt the decline. Further falls below this last will confirm a longer term bearish trend and open doors for a retest of the 0.6900 level. In the meantime, the short term picture is bearish as in the 1 hour chart, the price is below a strongly bearish 20 SMA, while the technical indicators are consolidating near oversold territory. In the 4 hours chart, the technical indicators are posting tepid bounces from oversold readings, but are far from suggesting a change in the bearish dominant trend.
Support levels: 0.7130 0.7100 0.7065
Resistance levels: 0.7205 0.7240 0.7280
Information on these pages contains forward-looking statements that involve risks and uncertainties. Markets and instruments profiled on this page are for informational purposes only and should not in any way come across as a recommendation to buy or sell in these assets. You should do your own thorough research before making any investment decisions. FXStreet does not in any way guarantee that this information is free from mistakes, errors, or material misstatements. It also does not guarantee that this information is of a timely nature. Investing in Open Markets involves a great deal of risk, including the loss of all or a portion of your investment, as well as emotional distress. All risks, losses and costs associated with investing, including total loss of principal, are your responsibility. The views and opinions expressed in this article are those of the authors and do not necessarily reflect the official policy or position of FXStreet nor its advertisers. The author will not be held responsible for information that is found at the end of links posted on this page.
If not otherwise explicitly mentioned in the body of the article, at the time of writing, the author has no position in any stock mentioned in this article and no business relationship with any company mentioned. The author has not received compensation for writing this article, other than from FXStreet.
FXStreet and the author do not provide personalized recommendations. The author makes no representations as to the accuracy, completeness, or suitability of this information. FXStreet and the author will not be liable for any errors, omissions or any losses, injuries or damages arising from this information and its display or use. Errors and omissions excepted.
The author and FXStreet are not registered investment advisors and nothing in this article is intended to be investment advice.
Recommended Content
Editors’ Picks
EUR/USD holds above 1.0700 after German inflation data

EUR/USD trades modestly higher on the day above 1.0700. The data from Germany showed that the annual HICP inflation edged higher to 2.4% in April. This reading came in above the market expectation of 2.3% and helped the Euro hold its ground.
USD/JPY recovers above 156.00 following suspected intervention

USD/JPY recovers ground and trades above 156.00 after sliding to 154.50 on what seemed like a Japanese FX intervention. Later this week, Federal Reserve's policy decisions and US employment data could trigger the next big action.
Gold holds steady above $2,330 to start the week

Gold fluctuates in a relatively tight channel above $2,330 on Monday. The benchmark 10-year US Treasury bond yield corrects lower and helps XAU/USD limit its losses ahead of this week's key Fed policy meeting.
Week Ahead: Bitcoin could surprise investors this week Premium

Two main macroeconomic events this week could attempt to sway the crypto markets. Bitcoin (BTC), which showed strength last week, has slipped into a short-term consolidation.
Five Fundamentals for the week: Fed fears, Nonfarm Payrolls, Middle East promise an explosive week Premium

Higher inflation is set to push Fed Chair Powell and his colleagues to a hawkish decision. Nonfarm Payrolls are set to rock markets, but the ISM Services PMI released immediately afterward could steal the show.
