The markets strike back

USD: Jun '24 is Down at 105.535.
Energies: Jun '24 Crude is Down at 83.70.
Financials: The June '24 30 Year T-Bond is Up 20 ticks and trading at 114.15.
Indices: The Jun '24 S&P 500 emini ES contract is 36 ticks Higher and trading at 5140.50.
Gold: The Jun'24 Gold contract is trading Up at 2352.80.
Initial conclusion
This is not a correlated market. The USD is Down and Crude is Down which is not normal, and the 30 Year T-Bond is trading Higher. The Financials should always correlate with the US dollar such that if the dollar is Higher, then the bonds should follow and vice-versa. The S&P is Higher and Crude is trading Lower which is correlated. Gold is trading Higher which is correlated with the US dollar trading Up. I tend to believe that Gold has an inverse relationship with the US Dollar as when the US Dollar is down, Gold tends to rise in value and vice-versa. Think of it as a seesaw, when one is up the other should be down. I point this out to you to make you aware that when we don't have a correlated market, it means something is wrong. As traders you need to be aware of this and proceed with your eyes wide open. All of Asia is trading Higher. Currently Europe is trading Higher with the exception of the Milan and Spanish IBEX exchanges which are Lower.
Possible challenges to traders
-
No Major Economic News to speak of.
-
Lack of Major Economic News.
Treasuries
Traders, please note that we've changed the Bond instrument from the 30 year (ZB) to the 10 year (ZN). They work exactly the same.
We've elected to switch gears a bit and show correlation between the 10-year bond (ZN) and the S&P futures contract. The S&P contract is the Standard and Poor's, and the purpose is to show reverse correlation between the two instruments. Remember it's likened to a seesaw, when up goes up the other should go down and vice versa.
On Friday the ZN migrated Higher at around 8:45 AM EST as the ZN hit a Low at around that time and the S&P hit a High moving Lower. If you look at the charts below the ZN gave a signal at around 10 AM and started its Upward climb. Look at the charts below and you'll see a pattern for both assets. S&P hit a High at around 8:45 AM and migrated Lower. These charts represent the newest version of MultiCharts and I've changed the timeframe to a 15-minute chart to display better. This represented a Long opportunity on the 10-year note, as a trader you could have netted about a dozen ticks per contract on this trade. Each tick is worth $15.625. Please note: the front month for both the ZN and the S&P are now Jun '24. I've changed the format to filled Candlesticks (not hollow) such that it may be more apparent and visible.
Charts courtesy of MultiCharts built on an AMP platform

ZN -Jun 2024 - 04/26/24
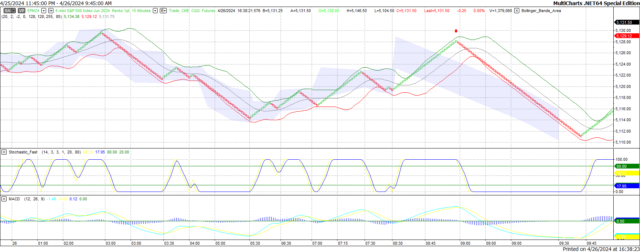
S&P - Jun 2024 - 04/26/24
Bias
On Friday we gave the markets an Upside bias as the markets looked to regain some of the momentum lost on Thursday. The markets didn't disappoint as the Dow gained 154 points and the other indices gained ground as well. Today we aren't dealing with a correlated market and our bias is to the Upside.
Could this change? Of Course. Remember anything can happen in a volatile market.
Commentary
Well, it seems as though the markets regained some of its composure that it lost on Thursday. The markets did regain some of its territory as the Dow advanced 154 points, the S&P regained 52 and the Nasdaq 316 points. Today we have no news to drive the markets in one direction or another but later this week that will change. We have an FOMC meeting on Wednesday and Non-Farm Payrolls on Friday. Come Wednesday we have nine major economic reports and an FOMC Press Conference out after the interest rate announcement. Will this be enough to project the markets Higher?
Author

Nick Mastrandrea
Market Tea Leaves


