EUR/USD Current price: 1.1169
View Live Chart for the EUR/USD

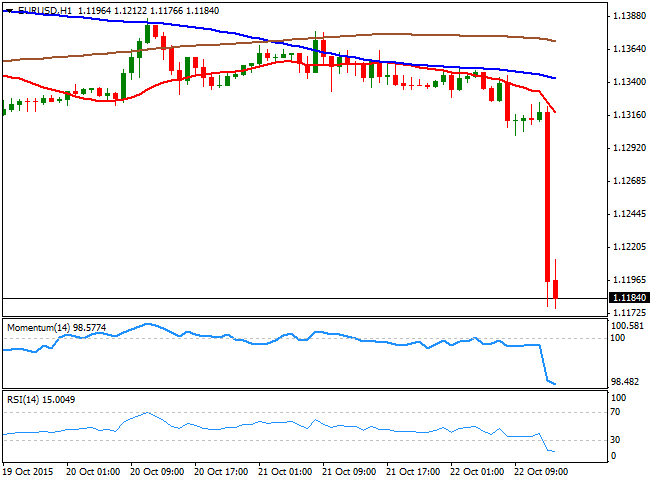
The common currency plunged around 150 pips against the greenback, following ultra dovish comments from ECB's President, Mario Draghi. The head of the ECB reiterated that they will maintain QE until September 2016 or beyond if needed, but added that monetary accommodation will be "re-examined" in December. Additionally, he said that officials discussed the possibility of cutting rates further into negative territory, and while he did actually nothing, the dovish tone and the possibility of a rate cut in December was enough to force investors out of the EUR. Stocks accelerated in Europe and the US after the news, fueled also by better-than-expected US weekly unemployment claims.
Technically, the 1 hour chart shows that the pair continues pressuring the lows in the 1.1170 region, with quite limited pullbacks seen so far today. In the same chart, the technical indicators maintain their sharp bearish slopes in extreme oversold levels, leaving little room for an upward corrective movement at the time being. In the 4 hours chart, the technical indicators have turned sharply lower below their mid-lines, whilst the price has extended well below its moving averages, supporting a continued decline towards 1.1120 a major support level-
Support levels: 1.1160 1.1120 1.1080
Resistance levels: 1.1245 1.1290 1.1335
GBP/USD Current price: 1.5399
View Live Chart for the GPB/USD
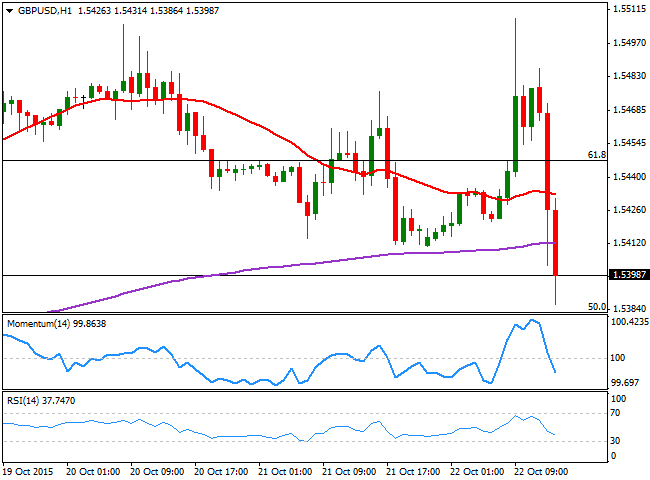
The GBP/USD pair advanced up to 1.5507 early Europe, on an upward surprise coming from the UK Retail Sales data, which resulted much better-than-expected in September. The pair however, was limited by speculative selling that has contained advances around the 1.5500 figure, ever since the week started. Improved US data and the negative tone of the ECB, dragged the pair to a fresh weekly low of 1.5386, and it currently holds a handful of pips below the 1.5400 figure, with the 1 hour chart suggesting the pair may decline further, as the technical indicators head sharply lower below their mid-lines, whilst the price is now extending below its 20 SMA. The pair has a strong Fibonacci support at 1.5380, the 50% retracement of its latest daily decline, and a break below it will likely signal additional declines during the rest of the day. In the 4 hours chart, the technical indicators turned lower in negative territory, presenting a limited bearish momentum at the time being, given that the price is not far away from its latest range.
Support levels: 1.5380 1.5350 1.5320
Resistance levels: 1.5415 1.5450 1.5495
USD/JPY Current price: 120.28
View Live Chart for the USD/JPY
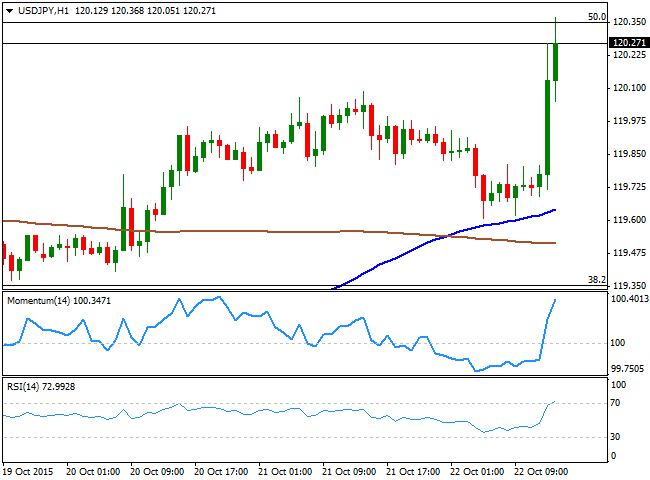
Pressuring a critical resistance at 120.35. The USD/JPY pair soared up to 120.36 and trades nearby at the beginning of the US session, boosted by dollar's demand after a dovish ECB's Draghi. The European Central Bank has announced it will review the amount of its QE next December, whilst during this meeting, discussed the possibility of cutting rates further into negative territory. Also, US weekly unemployment claims resulted at 259K better than the 265K expected. Technically speaking, the pair presents a strong upward potential, as the technical indicators continue heading north near overbought levels, whilst the price is well above its 100 and 200 SMAs. In the 4 hours chart, the technical indicators also present a strong upward momentum, in line with additional advances. Nevertheless, the pair needs to clearly break a major Fibonacci resistance that converges with the mentioned daily high, to confirm a steady advance up to the 121.00 price zone.
Support levels: 119.70 119.35 118.90
Resistance levels: 120.35 120.70 121.10
AUD/USD Current price: 0.7231
View Live Chart for the AUD/USD
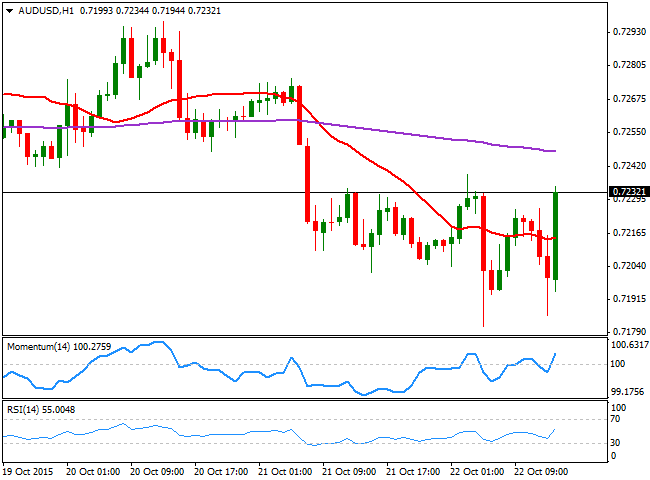
The AUD/USD pair is quickly recovering from an early dip below the 0.7200, as despite ongoing dollar demand, Aussie is being benefited by the strong upward momentum in stocks. Nevertheless, the pair is still below the key 0.7240 resistance, and needs to extend beyond it to confirm further gains. The 1 hour chart shows that the technical indicators head higher after crossing their mid-lines, whilst the price is above its 20 SMA, in line with an upward continuation. In the 4 hours chart, however, the technical indicators remain in negative territory, whilst the 20 SMA heads strongly lower in the 0.7240 region, confirming the strength of the static resistance level.
Support levels: 0.7205 0.7170 0.7130
Resistance levels: 0.7240 0.7290 0.7335
Information on these pages contains forward-looking statements that involve risks and uncertainties. Markets and instruments profiled on this page are for informational purposes only and should not in any way come across as a recommendation to buy or sell in these assets. You should do your own thorough research before making any investment decisions. FXStreet does not in any way guarantee that this information is free from mistakes, errors, or material misstatements. It also does not guarantee that this information is of a timely nature. Investing in Open Markets involves a great deal of risk, including the loss of all or a portion of your investment, as well as emotional distress. All risks, losses and costs associated with investing, including total loss of principal, are your responsibility. The views and opinions expressed in this article are those of the authors and do not necessarily reflect the official policy or position of FXStreet nor its advertisers. The author will not be held responsible for information that is found at the end of links posted on this page.
If not otherwise explicitly mentioned in the body of the article, at the time of writing, the author has no position in any stock mentioned in this article and no business relationship with any company mentioned. The author has not received compensation for writing this article, other than from FXStreet.
FXStreet and the author do not provide personalized recommendations. The author makes no representations as to the accuracy, completeness, or suitability of this information. FXStreet and the author will not be liable for any errors, omissions or any losses, injuries or damages arising from this information and its display or use. Errors and omissions excepted.
The author and FXStreet are not registered investment advisors and nothing in this article is intended to be investment advice.
Recommended Content
Editors’ Picks
EUR/USD retreats to 1.0750, eyes on Fedspeak

EUR/USD stays under modest bearish pressure and trades slightly near 1.0750 on Wednesday. Hawkish comments from Fed officials help the US Dollar stay resilient and don't allow the pair to stage a rebound.
GBP/USD struggles to hold above 1.2500 ahead of Thursday's BoE event

GBP/USD stays on the back foot and trades in negative territory below 1.2500 after losing nearly 0.5% on Tuesday. The renewed US Dollar strength on hawkish Fed comments weighs on the pair as market focus shifts to the BoE's policy announcements on Thursday.
Gold fluctuates in narrow range below $2,320

After retreating to the $2,310 area early Wednesday, Gold regained its traction and rose toward $2,320. Hawkish tone of Fed policymakers help the US Treasury bond yields edge higher and make it difficult for XAU/USD to gather bullish momentum.
SEC vs. Ripple lawsuit sees redacted filing go public, XRP dips to $0.51

Ripple (XRP) dipped to $0.51 low on Wednesday, erasing its gains from earlier this week. The Securities and Exchange Commission (SEC) filing is now public, in its redacted version.
Softer growth, cooler inflation and rate cuts remain on the horizon

Economic growth in the US appears to be in solid shape. Although real GDP growth came in well below consensus expectations, the headline miss was mostly the result of larger-than-anticipated drags from trade and inventories.