EUR/USD Current price: 1.1236
View Live Chart for the EUR/USD
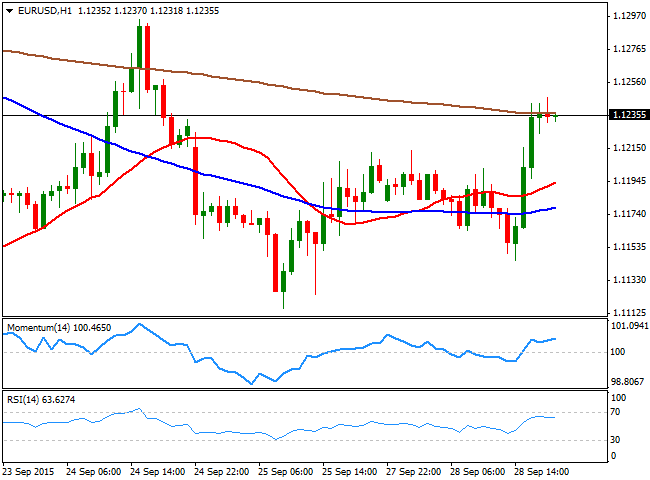
A dull Monday ended with the safe-haven currencies generally higher and the dollar mixed across the board, with the EUR/USD advancing up to 1.1247 in the American afternoon, and having spent the rest of the day consolidating nearby. Financial markets were all about sentiment this Monday, with increasing fear of Chinese economic slowdown spreading worldwide leading the way.
Data coming from the US was soft, as the PCE figures for August showed that personal income shrank to 0.3%, while spending rose to 0.4%. Monthly basis, the PCE price index came out at 0.0%, but advanced to 1.3% from previous 1.2% yearly basis. Pending home sales retreated in the same month, down 1.4% against expectations of a 0.5% advance. FED's officers fueled uncertainty, with Dudley stating that he expects the FED to hike later this year, but saying that will depend on upcoming data. Chicago FED's Evans on the other hand, resulted quite dovish, saying that he prefers a later lift-off to avoid the risk of lowering inflation.
Technically, the short term picture for the EUR/USD pair has turned slightly positive, although the pair stalled its intraday advance around a key static resistance level. But the 1 hour chart shows that the price is hovering around its 200 SMA after accelerating above the 100 and 20 SMAs, whilst the Momentum indicator heads slightly higher above the 100 level and the RSI indicator advances slowly around 64. In the 4 hours chart the price advanced above its 20 SMA, now offering an intraday support around 1.1200, whilst the RSI indicator turned north and advanced beyond 50 supporting additional advances towards the 1.1335 region for this Tuesday, on renewed demand beyond the mentioned daily high.
Support levels: 1.1200 1.1160 1.1120
Resistance levels: 1.1245 1.1290 1.1335
EUR/JPY Current price: 134.62
View Live Chart for the EUR/JPY
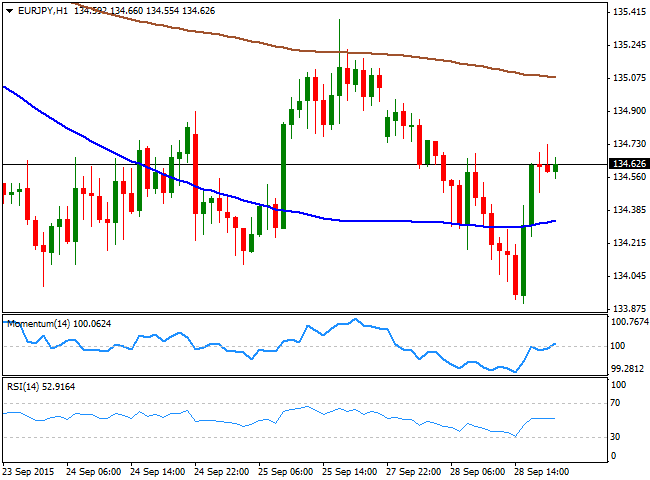
The EUR/JPY pair ended the day with limited losses, as the yen was on demand amid sliding stocks, but the EUR also surged against the greenback. Asian shares came under pressure on poor Chinese data, as in the country, industrial profits fell 8.8% in August from a year before, outpacing July's decline of 2.9%. Fears of a global economic slowdown spread among worldwide indexes, which resulted in a firm demand of the safe-haven yen. The pair traded as low as 133.90 intraday, but managed to recover to end the day above its 200 DMA, currently around 134.40. Shorter term, the 1 hour chart shows that the technical indicators have recovered from oversold readings, but turned flat around their mid-lines, as the price meets selling interest on approaches to the 135.00 level. In the same chart, the price is back above its 100 SMA that anyway remains horizontal, lacking directional strength. In the 4 hours chart, the Momentum indicator is flat around its 100 level whilst the RSI aims slightly higher around 48 and the price develops below its moving averages, all of which maintains the risk towards the downside.
Support levels: 134.40 133.90 133.30
Resistance levels: 135.35 135.80 136.20
GBP/USD Current price: 1.5170
View Live Chart for the GPB/USD
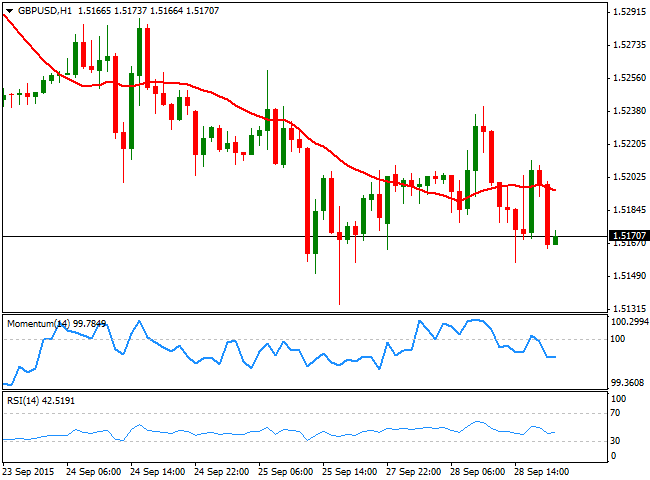
The GBP/USD pair ended the day in the red, after an early attempt to correct higher met selling interest at 1.5240, the daily high achieved after the European opening. There were no fundamental releases in the UK, but for this Thursday, BOE's Governor Carney is scheduled to speak, whilst the kingdom will also release its mortgage and money readings for August. The pair has been pretty much consolidating its latest losses, and the 1 hour chart shows that the price has briefly advanced above its 20 SMA before returning below it, whilst the technical indicators lack directional strength, but remain in negative territory. In the 4 hours chart, the 20 SMA capped the upside and currently offers and immediate resistance around 1.5210, while the Momentum indicator heads lower below its 100 level and the RSI indicator hovers around 34, all of which supports additional declines, particularly on a break below the 1.5120 support.
Support levels: 1.5150 1.5120 1.5070
Resistance levels: 1.5210 1.5245 1.5290
USD/JPY Current price: 119.77
View Live Chart for the USD/JPY
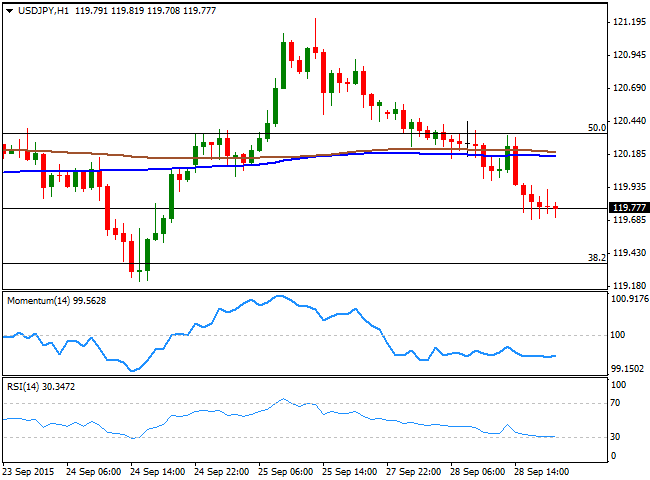
Downward momentum to extend below 119.35. The USD/JPY pair fell down to 119.69, and trades a few pips above it ahead of the Asian opening, having been under selling pressure ever since the day started. Sill trading within its usual range, the pair fell as risk aversion dominated investors all through the day, with the yen appreciating as stocks plunged. The short term picture shows that the 100 and 200 SMAs in the hourly chart are horizontal and within a 10 pips range around 120.10/20, a clear reflection of the ongoing range, whilst the technical indicators are losing their bearish strength, with the RSI indicator holding near oversold territory. In the 4 hours chart, the Momentum indicator has bounced from its mid-line, but remains in neutral territory, whilst the RSI heads sharply lower around 42, anticipating additional declines, particularly on a break below 119.35 a strong Fibonacci support.
Support levels: 119.70 119.35 118.90
Resistance levels: 120.00 120.35 120.70
AUD/USD Current price: 0.6987
View Live Chart for the AUD/USD
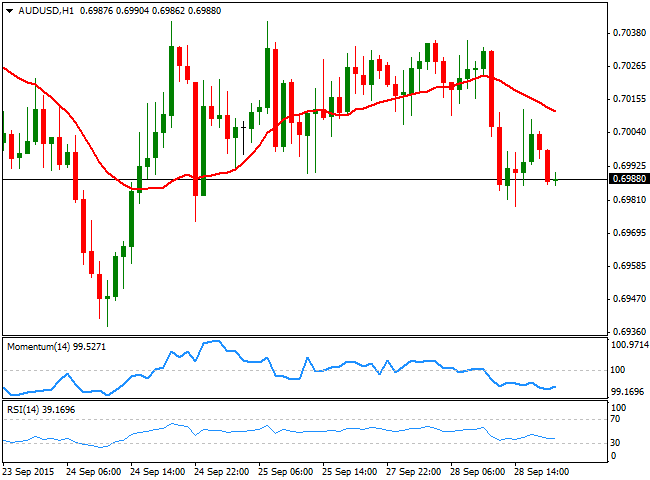
The Aussie could not cope with commodities' decline and broke below the 0.7000 figure against the greenback, extending its intraday decline down to 0.6978 before bouncing back before the end of the day. During the upcoming Asian session, Australia will release some credit and housing data, which if negative, may send the pair back to its recent lows near the 0.6900 level. In the meantime, the pair will remain sensitive to Chinese data and stocks movements. Technically, the 1 hour chart shows that the price is now developing below a bearish 20 SMA, whilst the technical indicators have lost their downward strength, but remain well below their mid-lines. In the 4 hours chart the price is back below a bearish 20 SMA after failing to rally above it earlier in the day, whilst the Momentum indicator turned sharply lower and is currently breaking below its 100 level, and the RSI indicator heads lower around 40, all of which supports a bearish continuation for the upcoming sessions.
Support levels: 0.6955 0.6930 0.6900
Resistance levels: 0.7035 0.7070 0.7110
Information on these pages contains forward-looking statements that involve risks and uncertainties. Markets and instruments profiled on this page are for informational purposes only and should not in any way come across as a recommendation to buy or sell in these assets. You should do your own thorough research before making any investment decisions. FXStreet does not in any way guarantee that this information is free from mistakes, errors, or material misstatements. It also does not guarantee that this information is of a timely nature. Investing in Open Markets involves a great deal of risk, including the loss of all or a portion of your investment, as well as emotional distress. All risks, losses and costs associated with investing, including total loss of principal, are your responsibility. The views and opinions expressed in this article are those of the authors and do not necessarily reflect the official policy or position of FXStreet nor its advertisers. The author will not be held responsible for information that is found at the end of links posted on this page.
If not otherwise explicitly mentioned in the body of the article, at the time of writing, the author has no position in any stock mentioned in this article and no business relationship with any company mentioned. The author has not received compensation for writing this article, other than from FXStreet.
FXStreet and the author do not provide personalized recommendations. The author makes no representations as to the accuracy, completeness, or suitability of this information. FXStreet and the author will not be liable for any errors, omissions or any losses, injuries or damages arising from this information and its display or use. Errors and omissions excepted.
The author and FXStreet are not registered investment advisors and nothing in this article is intended to be investment advice.
Recommended Content
Editors’ Picks

EUR/USD consolidates weekly gains above 1.1150
EUR/USD moves up and down in a narrow channel slightly above 1.1150 on Friday. In the absence of high-tier macroeconomic data releases, comments from central bank officials and the risk mood could drive the pair's action heading into the weekend.

GBP/USD stabilizes near 1.3300, looks to post strong weekly gains
GBP/USD trades modestly higher on the day near 1.3300, supported by the upbeat UK Retail Sales data for August. The pair remains on track to end the week, which featured Fed and BoE policy decisions, with strong gains.

Gold extends rally to new record-high above $2,610
Gold (XAU/USD) preserves its bullish momentum and trades at a new all-time high above $2,610 on Friday. Heightened expectations that global central banks will follow the Fed in easing policy and slashing rates lift XAU/USD.

Week ahead – SNB to cut again, RBA to stand pat, PCE inflation also on tap
SNB is expected to ease for third time; might cut by 50bps. RBA to hold rates but could turn less hawkish as CPI falls. After inaugural Fed cut, attention turns to PCE inflation.

Bank of Japan set to keep rates on hold after July’s hike shocked markets
The Bank of Japan is expected to keep its short-term interest rate target between 0.15% and 0.25% on Friday, following the conclusion of its two-day monetary policy review. The decision is set to be announced during the early Asian session.

Moneta Markets review 2024: All you need to know
VERIFIED In this review, the FXStreet team provides an independent and thorough analysis based on direct testing and real experiences with Moneta Markets – an excellent broker for novice to intermediate forex traders who want to broaden their knowledge base.
