EUR/USD Current price: 1.1249
View Live Chart for the EUR/USD
The US economy grew at a faster-than-expected pace during the second quarter of this 2015, at least according to the preliminary reading of the GDP that posted a whopping 3.7% against expectations of a 3.2% advance. The American dollar extended its early advance, as investors entered the European session with a positive mood, following a strong recovery in China's stocks. The US also released its Pending Home Sales for July, up 0.5%, slightly below expected, but up for the sixth time in seven months.
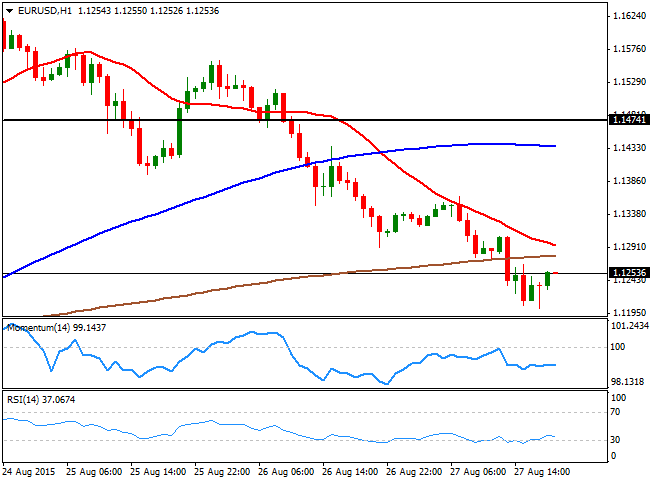
The EUR/USD pair has declined to a fresh weekly low of 1.1202 before bouncing up to the current 1.1250 area, and still looking short-term heavy, as in the 1 hour chart, the price is clearly consolidating below its 200 SMA, whilst the technical indicators are posting mild declines below their mid-lines. In the 4 hours chart, the technical indicators are bouncing from oversold readings, but remain far from suggesting the decline is over, whilst the 20 SMA has turned sharply lower well above the current price. A break below 1.1200 should see the pair extending its decline down to 1.1120, a key mid-term static support level.
Support levels: 1.1200 1.1160 1.1120
Resistance levels: 1.1280 1.1320 1.1350
EUR/JPY Current Price: 136.01
View Live Chart for the EUR/JPY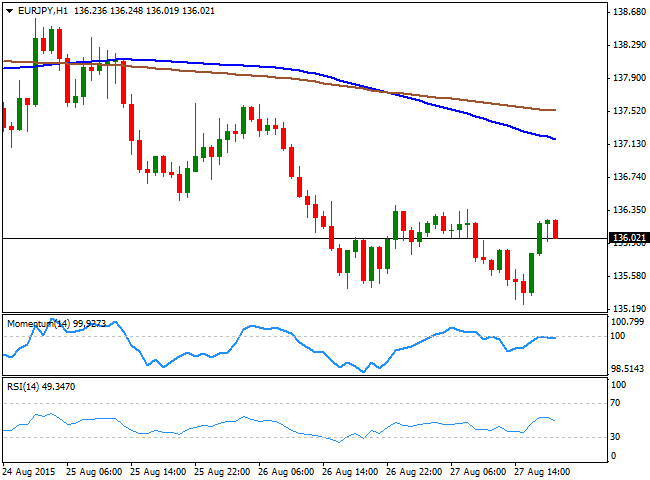
The EUR/JPY edged lower for the fourth day in-a-row, reaching 135.52 on EUR weakness, from where it bounced back to the 136.00 region, where it stands by the end of the day. Daily basis, the pair has set a lower low and a lower high, which implies a strong downward continuation, also considering the price is well below the 100 DMA. Shorter term, the 1 hour chart shows that the 100 SMA accelerated below the 200 SMA, whilst the Momentum indicator turned slightly lower around its mid-line, whilst the RSI turned lower, and stands now around 49. In the 4 hours chart, the technical indicators are aiming slightly higher from oversold territory, but remain well in the red, supporting the shorter term outlook.
Support levels: 135.45 134.90 134.40
Resistance levels: 136.20 136.65 137.10
GBP/USD Current price: 1.5411
View Live Chart for the GPB/USD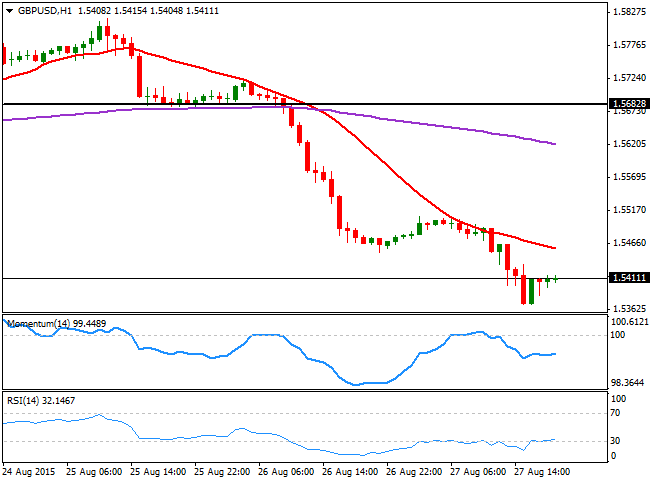
The British Pound remained under a strong selling pressure, with latest buyers quickly unwinding their long positions and fueling the decline. The release of the US Q2 GDP positive data sent the GBP/USD pair down to 1.5369, a fresh monthly low. On Friday, the UK will release the second estimate of the Q2 GDP figures, expected to match the previous estimate of 0.7%. The Pound may get a boost from an improved reading, but it will take at least a recovery above 1.5470 to take the pressure of the GBP/USD. Technically, the bias is lower, as the price is well below the mentioned 1.5460/70 region that has attracted buyers for most of the last month, and the 1 hour chart shows that the 20 SMA heads lower around the same price zone, whilst the technical indicators stand flat well below their mid-lines. In the 4 hours chart the technical indicators are posting limited bounces from extreme oversold readings, rather reflecting the ongoing short term upward correction than suggesting the pair may advance more.
Support levels: 1.5370 1.5335 1.5290
Resistance levels: 1.5430 1.5760 1.5710
USD/JPY Current price: 120.80
View Live Chart for the USD/JPY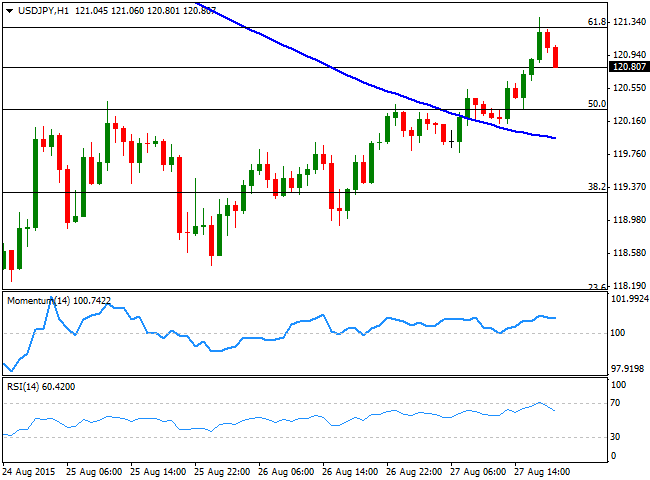
The USD/JPY pair regained the 120.00 level during the past Asian session, boosted by the recovery in Asian share markets and renewed dollar's buying interest. The pair however, held near the 120.50 before finally surging in the American afternoon, up to 121.39, meeting selling interest around the 61.8% retracement of these last two-weeks decline. Japan will release its National and Tokyo inflation during the upcoming session, and better-than-expected results may help the yen extending its recovery. Short term, the 1 hour chart shows that the price is now well above its 100 SMA that anyway maintains a bearish slope, whilst the RSI retreats from overbought readings, now heading lower around 61, limiting the upside as long as the price holds below the mentioned Fibonacci level. In the 4 hours chart, the Momentum indicator turned south, but remains above the 100 level, whilst the RSI hovers around 53, supporting additional gains, should the price extend beyond 121.40.
Support levels: 120.30 119.90 119.60
Resistance levels: 121.00 121.40 121.75
AUD/USD Current price: 0.7169
View Live Chart for the AUD/USD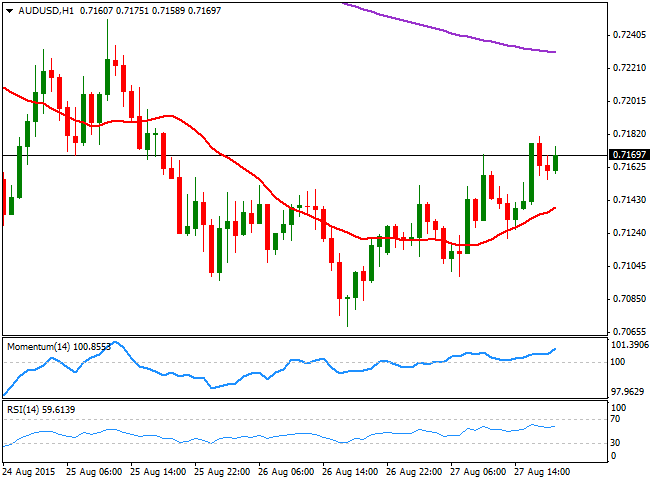
The AUD/USD pair closed the day with gains and near its daily high of 0.7181 maintaining its weekly inverted correlation with other high yielders, such as the EUR and the GBP. The Aussie gained some charm after the latest RBA meeting Minutes, when Governor Glenn Stevens said that the currency have done enough to help in the economic recovery. But Chinese turmoil these last 2-weeks, has weighed on the AUD, as most of its mining exports go to the troubled country. Since the situation seems to be stabilizing, the AUD/USD may continue advancing, although it’s a bit too early to confirm midterm gains. Short term, the 1 hour chart shows that the price is well above a bullish 20 SMA, whilst the Momentum indicator heads sharply higher and the RSI indicator advances around 61. In the 4 hours chart, the price is above its 20 SMA, whilst the RSI heads higher around 50, but the Momentum indicator turns lower below its 100 level, suggesting an advance beyond 0.7200, the immediate resistance, is required to confirm a new leg up.
Support levels: 0.7150 0.7110 0.7070
Resistance levels: 0.7200 0.7240 0.7290
Recommended Content
Editors’ Picks
AUD/USD: Gains appear capped near 0.6580

AUD/USD made a sharp U-turn on Tuesday, reversing six consecutive sessions of gains and tumbling to multi-day lows near 0.6480 on the back of the robust bounce in the Greenback.
EUR/USD looks depressed ahead of FOMC

EUR/USD followed the sour mood prevailing in the broader risk complex and plummeted to multi-session lows in the vicinity of 1.0670 in response to the data-driven rebound in the US Dollar prior to the Fed’s interest rate decision.
Gold stable below $2,300 despite mounting fears

Gold stays under selling pressure and confronts the $2,300 region on Tuesday against the backdrop of the resumption of the bullish trend in the Greenback and the decent bounce in US yields prior to the interest rate decision by the Fed on Wednesday.
Bitcoin price tests $60K range as Coinbase advances toward instant, low-cost BTC transfers

BTC bulls need to hold here on the daily time frame, lest we see $52K range tested. Bitcoin (BTC) price slid lower on Tuesday during the opening hours of the New York session, dipping its toes into a crucial chart area.
Federal Reserve meeting preview: The stock market expects the worst

US stocks are a sea of red on Tuesday as a mixture of fundamental data and jitters ahead of the Fed meeting knock risk sentiment. The economic backdrop to this meeting is not ideal for stock market bulls.