EUR/USD Current price: 1.1277
View Live Chart for the EUR/USD
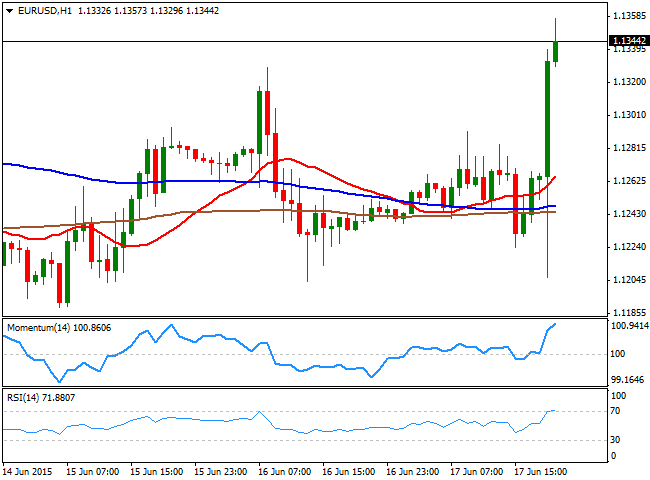
The dollar sold-off following the latest US Federal Reserve economic policy decision, much more dovish than initially anticipated. The Central Bank has lowered its growth projections for this 2015, not a shocker considering the results of the first quarter, but in its press conference, Mrs. Yellen has made it clear that the Central Bank is in no rush to raise rates, as the FOMC needs "more decisive evidence" of labor market strength and rising inflation before making a move. Furthermore, she added that wage growth is still subdued and that some cyclical weakness in the job market remains.
The EUR/USD pair reached a daily high of 1.1357 after being as low as 1.1204 earlier in the day, with the 1 hour chart maintaining a strong bullish bias, as the price has advanced well above its moving averages that anyway remain in tight range around 1.1240/50, whilst the technical indicators head sharply higher above their mid-lines, losing partially their upward strength in overbought territory. In the 4 hours chart, the price has advanced above its 20 SMA, whilst the technical indicators are now losing their upward potential after crossing their mid-lines towards the downside. Despite the latest sharp advance, the pair needs to extend beyond the 1.1385 region, where the price stalled twice in the last month, to confirm additional gains, whilst the lost of the 1.1300 figure should see the price returning to the 1.1250 region.
Support levels: 1.1290 1.1245 1.1210
Resistance levels: 1.1385 1.1420 1.460
EUR/JPY Current price: 139.87
View Live Chart for the EUR/JPY
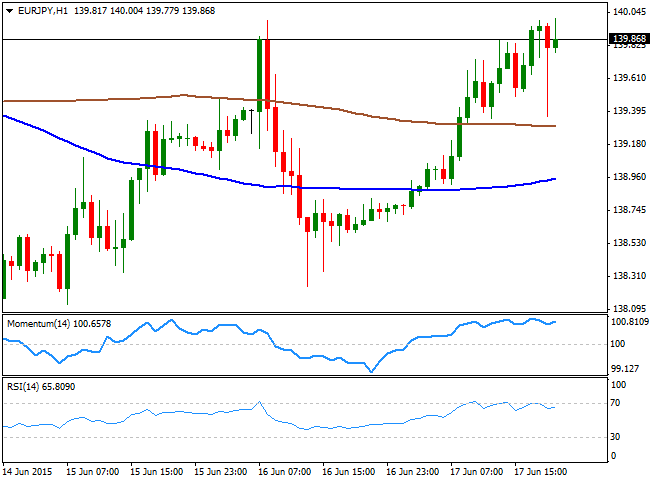
The EUR/JPY cross has flirted with the 140.00 level following FED's latest decision, as the Japanese Yen has been under selling pressure ever since the day started. With no catalyst behind JPY weakness, the pair has seen some wild spikes after the news, but seems to have recovered its bullish trend. Short term, the 1 hour chart shows that the price has recovered above the 100 and 200 SMAs, albeit the largest remains above the shortest, still not confirming a dominant bullish tone. In the same chart, the technical indicators have partially corrected overbought readings, but remain well above their mid-lines, whilst in the 4 hours chart, the 100 SMA has accelerated further below the current price whist the technical indicators remain in positive territory, albeit lacking upward strength. The critical level to watch over the upcoming hours, should the price advance beyond 140.00 is the 140.50 price zone, as a break above it should lead to a steady advance up to 141.00.
Support levels: 139.60 139.20 138.75
Resistance levels: 140.05 140.50 141.00
GBP/USD Current price: 1.5822
View Live Chart for the GBP/USD
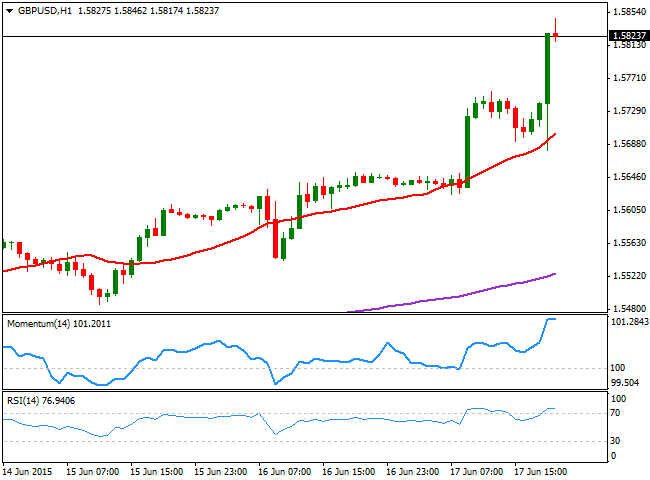
The British Pound reached a fresh year high against its American rival, soaring up to 1.5846, buoyant since early Europe, following the release of the UK monthly employment figures. The unemployment rate remained steady at 5.5% in the last 3 months, but the surprise came from wages that picked up to 2.7% against 2.1% expected. Alongside with employment figures, the BOE released the Minutes of its latest Minutes, showing no change, as all of the nine voting members agreed to leave the ongoing economic policy on hold. The pair added over 200 pips in the day, which has left the 1 hour technical indicators in extreme overbought territory. Nevertheless, the strong upward tone will likely persists. In the 4 hours chart, the technical indicators are beginning to look exhausted in extreme overbought levels, although the 20 SMA maintains a strong bullish slope well below the current level. Should the pair hold above the 1.5770 a midterm strong support level, the upside remains favored, with the market now looking for a test of the 1.6000 level.
Support levels: 1.5810 1.5770 1.5725
Resistance levels: 1.5845 1.5885 1.5920
USD/JPY Current price: 123.41
View Live Chart for the USD/JPY
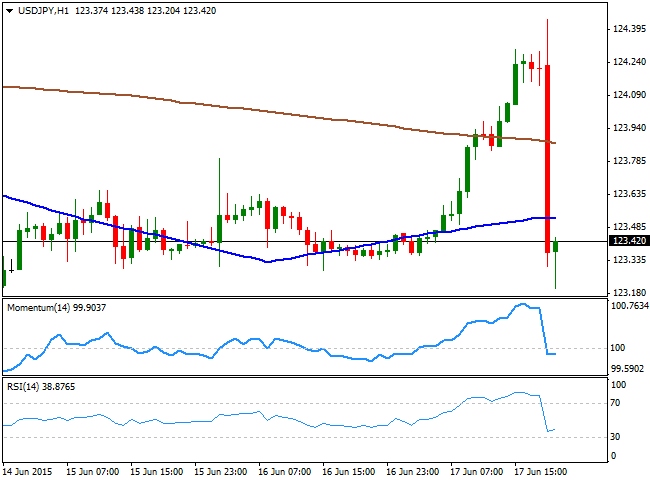
The USD/JPY pair advanced intraday up to a fresh 4-day high of 124.43, on market hopes of a hawkish stance coming from the US Central Bank, erasing all of its daily gains after the release. Having been as low as 123.20, buying interest has prevented the pair from falling further in quite a strong static support area. Nevertheless, the risk has turned towards the downside, and the 1 hour chart shows that the pair is back below its 100 and 200 SMAs after advancing above them intraday, whilst the Momentum indicator turned flat below the 100 level and the RSI indicator approached oversold territory. In the 4 hours chart, a mild negative tone prevails, with no extreme readings as the pair is pretty much where it has started the day. Renewed selling pressure below the 123.20 level, should lead to additional declines towards the 122.40 this Thursday.
Support levels: 123.20 122.80 122.40
Resistance levels: 123.70 124.10 124.45
AUD/USD Current price: 0.7743
View Live Chart for the AUD/USD
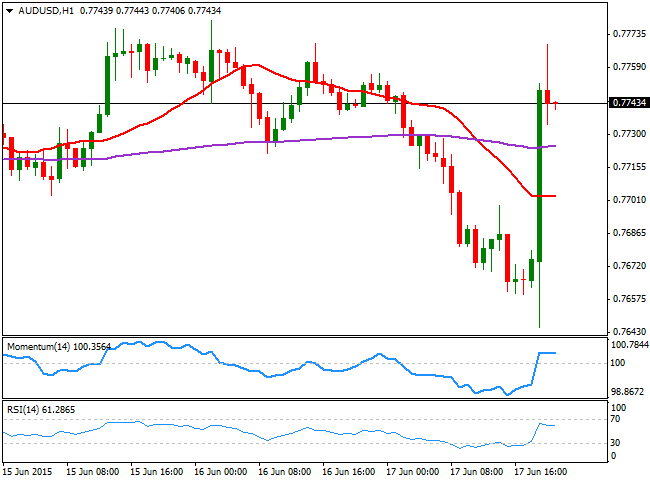
The Australian dollar sunk down to 0.7645 against the greenback, weighed earlier in the day by a sharp decline in the prices of iron ore that flirted with record lows. The price of iron ore has fallen for a third consecutive session, accelerating its decline amid concerns about the strength of the Chinese steel sector, during the past Asian session. Furthermore, the imbalance between the FED and the RBA has favored the intraday decline in the commodity currency, until a dovish statement reverted the intraday course. The pair rose up to 0.7769 and erased all of its intraday losses, with the 1 hour chart now showing a short term bullish tone, as the 1 hour chart shows that the price has recovered above its 20 SMA, whilst the technical indicators are back above their mid-lines, now consolidating. In the 4 hours chart, the price has stalled once again at its 200 EMA, a critical dynamic resistance level, currently around 0.7770, whilst the technical indicators have lost their upward strength and turned lower around their mid-lines, after correcting oversold readings reached earlier in the day.
Support levels: 0.7725 0.7690 0.7660
Resistance levels: 0.7770 0.7830 0.7880
Recommended Content
Editors’ Picks
EUR/USD holds above 1.0700 after US data

EUR/USD struggles to build on Wednesday's gains and fluctuates in a tight channel near 1.0700 on Thursday. The data from the US showed that weekly Jobless Claims held steady at 208,000, helping the USD hold its ground and limiting the pair's upside.
GBP/USD fluctuates above 1.2500 following Wednesday's rebound

GBP/USD stays in a consolidation phase slightly above 1.2500 on Thursday after closing in the green on Wednesday. A mixed market mood caps the GBP/USD upside after Unit Labor Costs and weekly Jobless Claims data from the US.
Gold retreats to $2,300 despite falling US yields

Gold stays under bearish pressure and trades deep in negative territory at around $2,300 on Thursday. The benchmark 10-year US Treasury bond edges lower following the Fed's policy decisions but XAU/USD struggles to find a foothold.
Top 3 Price Prediction BTC, ETH, XRP: Altcoins to pump once BTC bottoms out, slow grind up for now

Bitcoin reclaiming above $59,200 would hint that BTC has already bottomed out, setting the tone for a run north. Ethereum holding above $2,900 keeps a bullish reversal pattern viable despite falling momentum. Ripple coils up for a move north as XRP bulls defend $0.5000.
Happy Apple day

Apple is due to report Q1 results today after the bell. Expectations are soft given that Apple’s Chinese business got a major hit in Q1 as competitors increased their market share against the giant Apple.
