EUR/USD Current price: 1.1329
View Live Chart for the EUR/USD

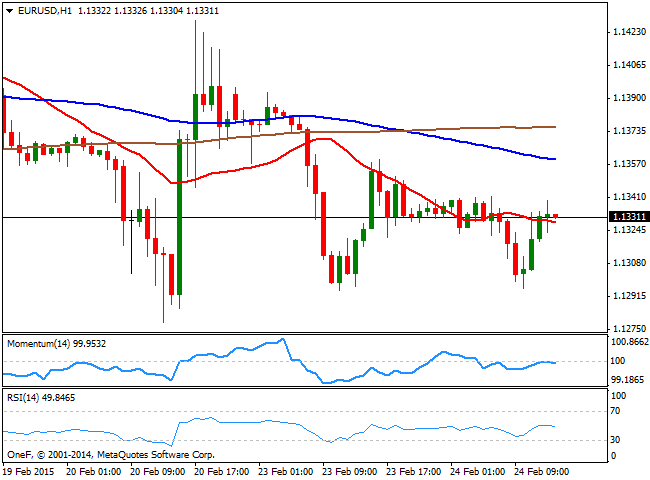
The EUR/USD continues to trade uneventfully around the 1.1300 level, with market's attention now in FED's Yellen testimony before the Houses, due to extend into Wednesday. In Europe, the final revision of January inflation readings came out as expected, barely affecting the pair. Greece sent a letter with the list of measures to apply to continue getting a bailout from the Troika, and its being review by EZ ministers at the time being. Early in the US session, the EUR/USD pair trades around 1.1330 with the 1 hour chart showing that the price struggles around a mild bearish 20 SMA, but holds below 100 and 200 ones, whilst indicators retrace after testing their midlines, maintaining a limited bearish tone. In the 4 hours chart, the technical readings maintain a neutral stance, with the price below a flat 20 SMA and the indicators going nowhere around their midlines.
Support levels: 1.1310 1.1280 1.1250
Resistance levels: 1.1345 1.1380 1.1430
GBP/USD Current price: 1.5429
View Live Chart for the GBP/USD
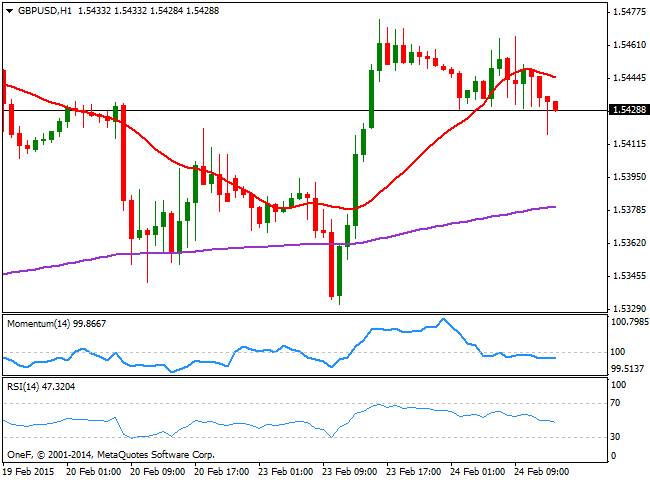
The GBP/USD pair trades lower in range, having set a daily low at 1.5416 so far today. The 1 hour chart shows an increasing short term bearish potential, with the price near the lows and below a bearish 20 SMA, and the indicators heading lower below their midlines. In the 4 hours chart the price holds above its 20 SMA that converges with the mentioned daily low, while the momentum indicator bounced from its midline, maintaining a positive tone and the RSI turned lower around 52, anticipating some further declines, particularly if 1.5415 support gives up.
Support levels: 1.5415 1.5385 1.5350
Resistance levels: 1.5480 1.5525 1.5570
USD/JPY Current price: 119.52
View Live Chart for the USD/JPY
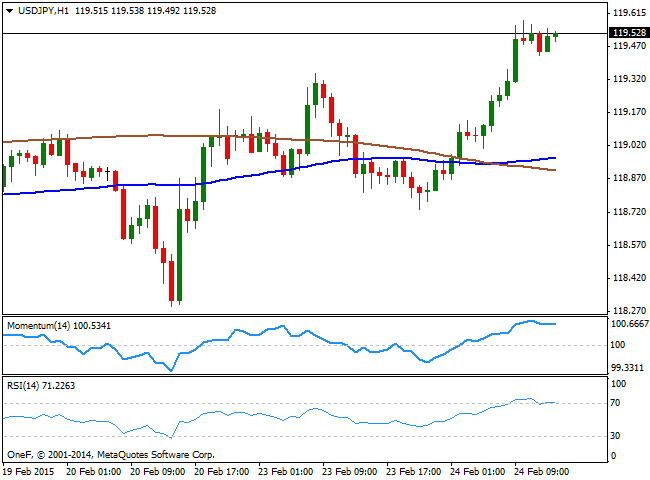
With worldwide stocks at record highs, the USD/JPY broke higher and trades near a fresh 2-week high set at 119.58. The 1 hour chart shows that the price advanced well above its moving averages, with the 100 SMA crossing above the 200 one, and the technical indicators maintaining their bullish slopes, despite being in overbought territory. In the 4 hours chart however, the technical readings are biased higher well into positive territory, which supports some additional advances as long as buyers surge on approaches to the 119.30/40 price zone.
Support levels: 119.40 119.00 118.60
Resistance levels: 119.85 120.20 120.55
AUD/USD Current price: 0.7764
View Live Chart for the AUD/USD
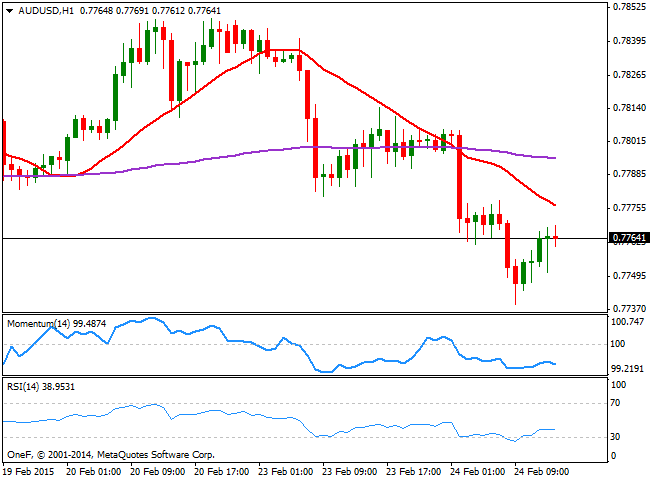
The AUD/USD fell down to 0.7738 during the European session, before bouncing up to the current level, although maintaining a negative tone as the 1 hour chart shows that the price develops below a strongly bearish 20 SMA, while the technical indicators head lower in negative territory. In the 4 hours chart, the technical picture favors the downside, with the price below a flat 20 SMA and indicators extending their slopes into negative territory. At this point, a break below 0.7720 is required to confirm another leg south, while recoveries up to 0.7830 will offer chances to sell higher rather than support a reversal.
Support levels: 0.7750 0.7720 0.7680
Resistance levels: 0.7790 0.7830 0.7865
Recommended Content
Editors’ Picks
AUD/USD regains the constructive outlook above the 200-day SMA

AUD/USD advanced strongly for the second session in a row, this time extending the recovery to the upper 0.6500s and shifting its focus to the weekly highs in the 0.6580-0.6585 band, an area coincident with the 100-day SMA.
EUR/USD keeps the bullish performance above 1.0700

The continuation of the sell-off in the Greenback in the wake of the FOMC gathering helped EUR/USD extend its bounce off Wednesday’s lows near 1.0650, advancing past the 1.0700 hurdle ahead of the crucial release of US NFP on Friday.
Gold stuck around $2,300 as market players lack directional conviction

Gold extended its daily slide and dropped below $2,290 in the second half of the day on Thursday. The benchmark 10-year US Treasury bond yield erased its daily losses after US data, causing XAU/USD to stretch lower ahead of Friday's US jobs data.
Bitcoin price rises 5% as BlackRock anticipates a new wave of capital inflows into BTC ETFs from investors

Bitcoin (BTC) price slid to the depths of $56,552 on Wednesday as the cryptocurrency market tried to front run the Federal Open Market Committee (FOMC) meeting. The flash crash saw millions in positions get liquidated.
FOMC in the rear-view mirror – NFP eyed

The update from May’s FOMC rate announcement proved more dovish than expected, which naturally weighed on the US dollar (sending the DXY to lows of 105.44) and US yields, as well as, initially at least, underpinning major US equity indices.