EUR/USD Current price: 1.1304
View Live Chart for the EUR/USD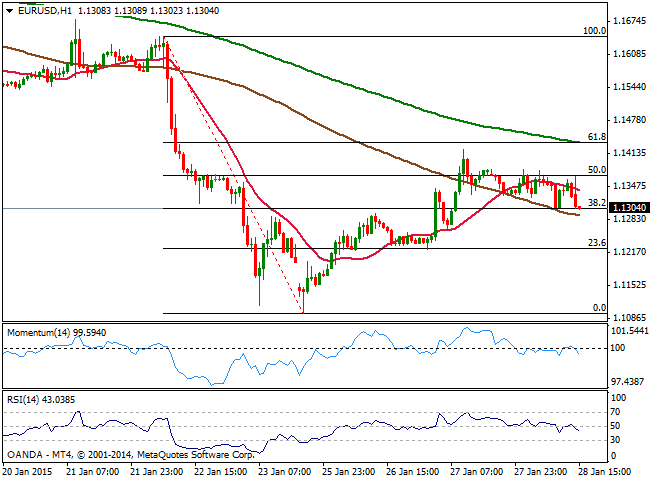
The so awaited FOMC statement resulted in a big disappointment for those expecting to trigger some action. The US Federal Reserve maintained the “patient” rhetoric when referring to hiking rates, and presented a more hawkish statement, citing evidence that the economy is strengthening especially when it comes to job market. In regards of inflation, the FOMC expects it to decline further in the near time, but considers that it will be something temporal. Dollar reaction post-release however, was quite soft, with majors contained within familiar ranges, and the EUR/USD trading between 1.3105/1.3160. The only exception came with a strong upward move in USD/CAD, most likely attributed to falling oil prices.
As for the EUR/USD, the 1 hour chart shows that the price remains contained in between Fibonacci levels, but capped below a mild bearish 20 SMA whilst indicators turn slightly lower in negative territory. In the 4 hours chart technical readings had lost the upward strength seen on Tuesday, and momentum now turned lower towards its midline while RSI stands flat around 50. The bearish trend remains firm in place despite early week recovery up to 1.1422, although some downward continuation is now required to confirm a new leg south: a break below 1.1250, 23.6% retracement of the same slide may be what it takes to see the pair resuming its bearish trend.
Support levels: 1.1305 1.1250 1.1210
Resistance levels: 1.1365 1.1400 1.1440
EUR/JPY Current price: 133.10
View Live Chart for the EUR/JPY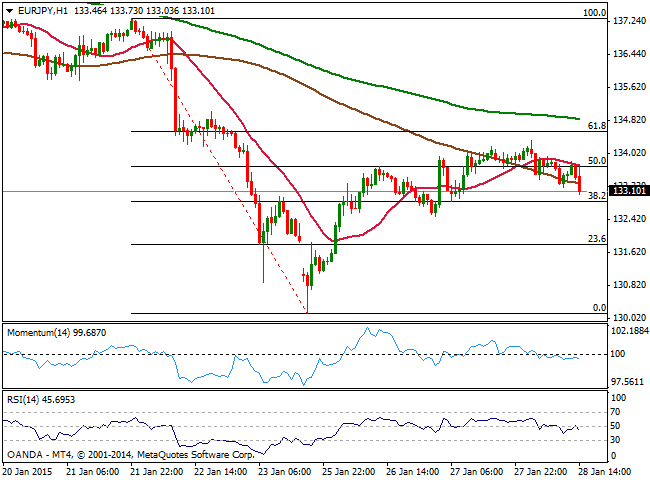
The EUR/JPY eases post FED after establishing a fresh weekly high at 134.35 earlier on the day. The Japanese yen is finding support in falling stocks, as US indexes remain under pressure. Technically, the 1 hour chart shows that the price extends below a bearish 100 SMA, capped by 20 SMA whilst indicator turn slightly lower in neutral territory. In the 4 hours chart, momentum indicator also turns lower and approaches now to its midline, while the price approaches to the 38.2% retracement of its latest bearish run at 132.80 the immediate support. A break below it should favor some continued decline, with little in the way until 131.70.
Support levels: 132.85 132.30 131.70
Resistance levels: 133.25 133.70 134.55
GBP/USD Current price: 1.5155
View Live Chart for the GBP/USD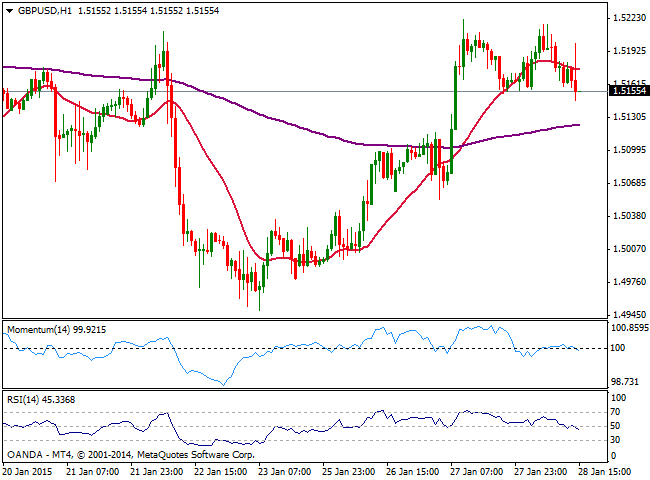
The GBP/USD pair reached fresh daily lows post-FOMC statement in the 1.5140 level, having failed earlier on the day to advance beyond the weekly high of 1.5224. There was no data released in the UK, and in fact the rest of the week will remain light in that front. The 1 hour chart shows that the pair set a short term double top around the mentioned high, with the neckline broke at 1.5160, now the immediate short term resistance. In the same time frame, 20 SMA turns lower above current price whilst indicators gain a mild negative tone although are still in neutral territory. In the 4 hours chart technical indicators ease from overbought territory, while the 20 SMA maintains a strong bullish slope below current price, offering dynamic support around the 1.5100 figure. This last level is key for the upcoming 24 hours as a break below it will anticipate a downward continuation, exposing the 1.5000 level for this Thursday.
Support levels: 1.5100 1.5070 1.5020
Resistance levels: 1.5160 1.5225 1.5265
USD/JPY Current price: 117.61
View Live Chart for the USD/JPY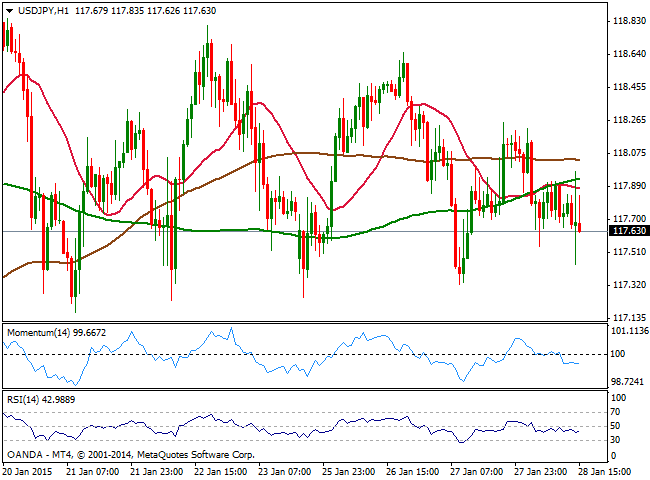
The USD/JPY pair has remained within its 117.00/118.80 range, gaining bearish tone after the US Federal Reserve decided to remain “patient”. US yields tumbled ahead of the Central Bank announcement, and remain subdued, with the 10Y yield at 1.73%, also supporting Yen strength. Technically the 1 hour chart shows indicators gaining bearish strength below their midlines, whilst the price develops below its moving averages. In the 4 hours chart the technical picture is quite similar to the 1 hour chart, all of which supports further declines, yet buying interest has been surging in the 117.00/30 area since mid January, which means a clear break below this area is required to confirm the move towards 116.60 in the short term.
Support levels: 117.30 117.00 116.60
Resistance levels: 118.00 118.40 118.90
AUD/USD Current price: 0.7928
View Live Chart of the AUD/USD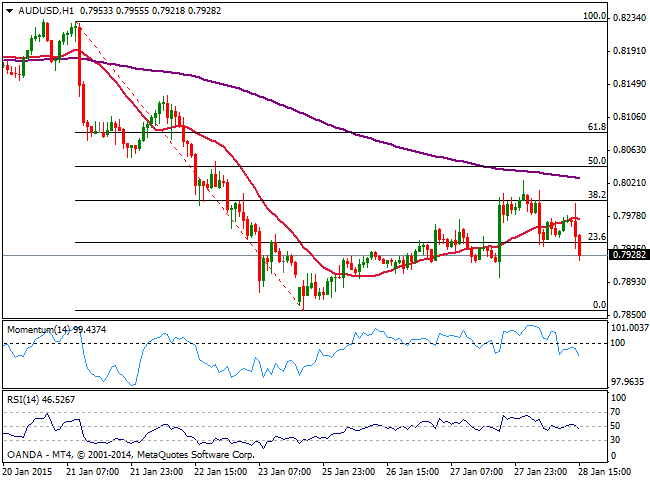
The AUD/USD pair broke lower late US session, weighted by New Zealand central bank economic policy decision. The RBNZ kept rates unchanged at 3.50%, but the statement was quite dovish while the Central Bank stated that the currency “remains unjustifiably and unsustainably high” pushing NZD/USD 100 pips lower to a fresh 4 years-low. As for the short term technical picture for the AUD/USD pair, the 1 hour chart shows price accelerating below the 23.6% retracement of its latest daily fall, as indicators gain bearish momentum below their midlines, pointing for a continued decline. In the 4 hours chart the price broke below its 20 SMA, while momentum turns lower above 100 and RSI holds in neutral territory. A continued slide through the 0.7900 figure, should lead to a retest of the recent multiyear low of 0.7860, while if this last gives up, the pair will likely extend towards the 0.7800 figure.
Support levels: 0.7900 0.7860 0.7810
Resistance levels: 0.7960 0.8000 0.8040
Recommended Content
Editors’ Picks
AUD/USD gains ground on hawkish RBA, Nonfarm Payrolls awaited

The Australian Dollar continues its winning streak for the third successive session on Friday. The hawkish sentiment surrounding the Reserve Bank of Australia bolsters the strength of the Aussie Dollar, consequently, underpinning the AUD/USD pair.
USD/JPY: Japanese Yen advances to nearly three-week high against USD ahead of US NFP

The Japanese Yen continues to draw support from speculated government intervention. The post-FOMC USD selling turns out to be another factor weighing on the USD/JPY pair. Investors now look forward to the crucial US NFP report for a fresh directional impetus.
Gold recoils on hawkish Fed moves, unfazed by dropping yields and softer US Dollar

Gold price clings to the $2,300 figure in the mid-North American session on Thursday amid an upbeat market sentiment, falling US Treasury yields, and a softer US Dollar. Traders are still digesting Wednesday’s Federal Reserve decision to hold rates unchanged.
Solana price pumps 7% as SOL-based POPCAT hits new ATH

Solana price is the biggest gainer among the crypto top 10, with nearly 10% in gains. The surge is ascribed to the growing popularity of projects launched atop the SOL blockchain, which have overtime posted remarkable success.
NFP: The ultimate litmus test for doves vs. hawks

US Nonfarm Payrolls will undoubtedly be the focal point of upcoming data releases. The estimated figure stands at 241k, notably lower than the robust 303k reported in the previous release and below all other readings recorded this year.