EUR/USD Current price: 1.3608
View Live Chart for the EUR/USD
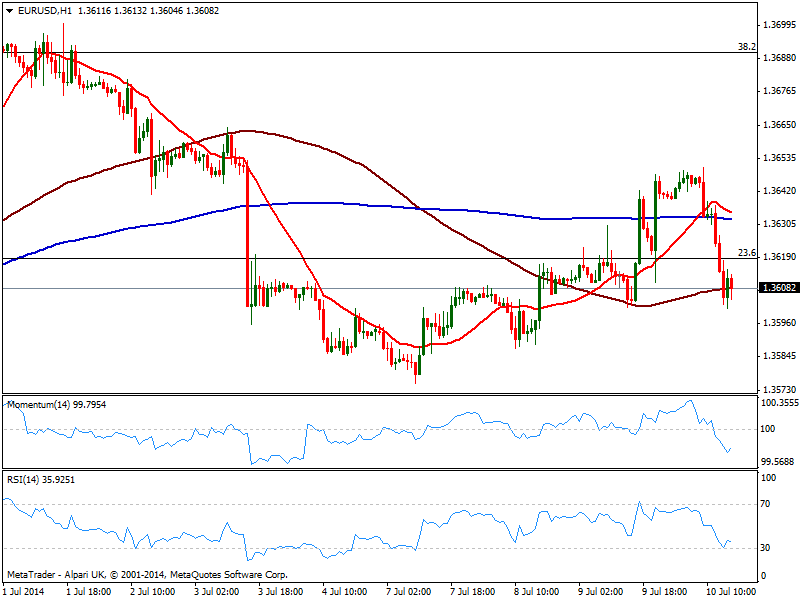
The EUR/USD gave up all the ground added after FOMC, with dollar and yen strongly up on risk aversion: having warned on market complacency just yesterday, stocks entered a selling spiral that points for a strong and continued slide for today. As for the EUR/USD technical picture, the hourly chart shows price holding right above 1.3600 figure, while indicators lost some of the downward potential but remains well into negative territory. In the 4 hours chart indicators present a strong bearish tone, yet hover above their midlines, not yet signaling a continued slide. The base of the range at 1.3570/80 continues to be the level to break to confirm a continued slide in the pair.
Support levels: 1.3570 1.3530 13500
Resistance levels: 1.3645 1.3675 1.3700
GBP/USD Current price: 1.7119
View Live Chart for the GBP/USD
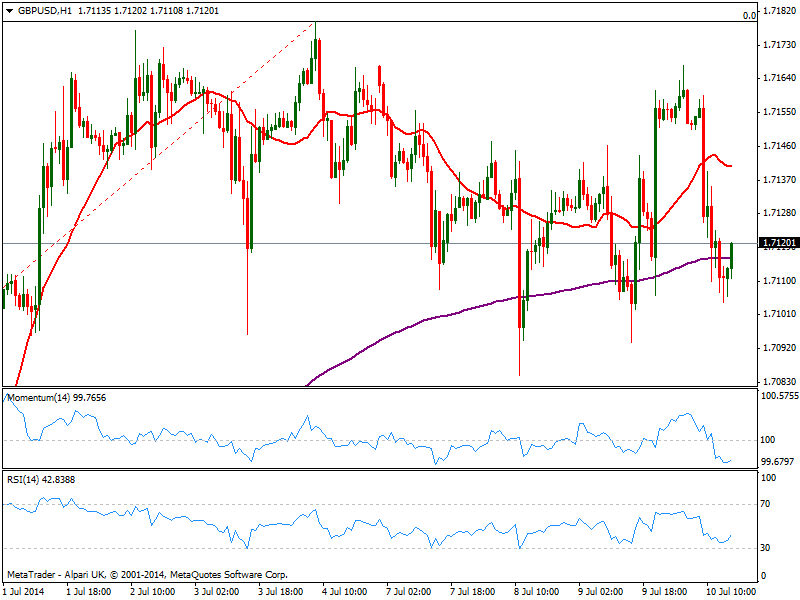
The GBP/USD eased some on the back of worse than expected UK trade balance readings, but holds pretty well above 1.7100 despite dollar intraday strength. The hourly chart shows indicators exhausted to the downside near oversold levels and turning back north, while 20 SMA stands flat above current price. In the 4 hours chart the technical picture is mild bearish, with risk to the downside limited by 1.7060, 23.6% retracement of the latest bullish run
Support levels: 1.7095 1.7060 1.7020
Resistance levels: 1.7150 1.7180 1.7220
USD/JPY Current price: 101.14
View Live Chart for the USD/JPY
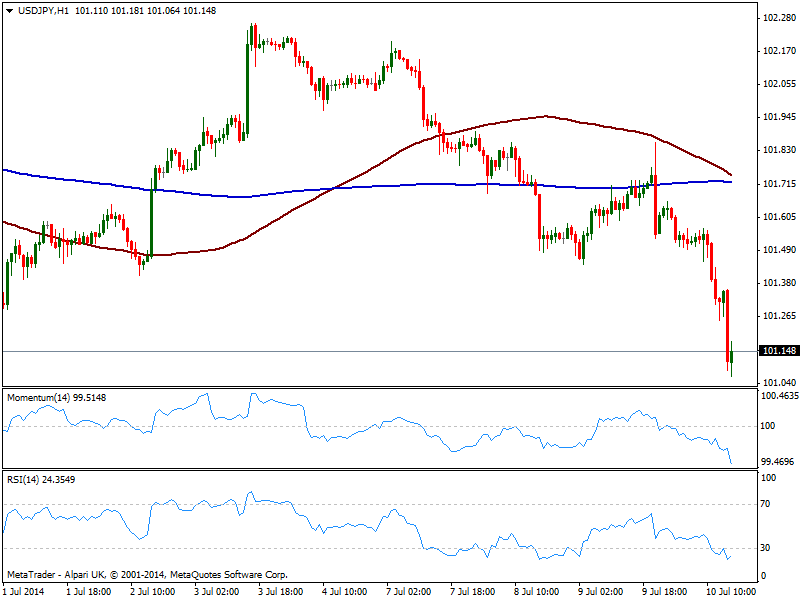
Yen leads the way this Thursday, with the USD/JPY flirting with the 101.00 level and trading at fresh 2-month lows. The hourly chart shows a strong bearish momentum, with 100 and 200 SMAs converging now in the 101.70 price zone. In the 4 hours chart technical readings also maintain a strong bearish tone, supporting a retest of this year low around 100.70. Immediate resistance stands now at 101.20/30 former daily lows.
Support levels: 101.00 100.70 100.25
Resistance levels: 101.30 101.70 101.95
AUD/USD Current price: 0.9369
View Live Chart for the AUD/USD
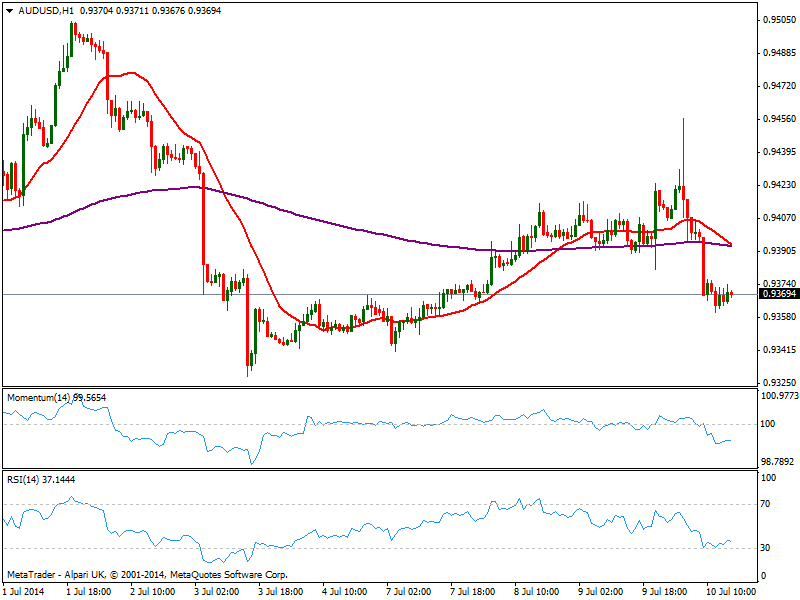
AUD/USD holds around critical 0.9370, supported by gold momentum, trading at $1342/oz, levels not seen since past March. The AUD/USD surged near 0.9460 but worse than expected local employment readings put the pair under pressure early Asia. Nevertheless, the hourly chart presents a mild bearish tone, with price below moving averages and indicators in negative territory, showing no actual momentum at the time being. In the 4 hours chart technical readings present a strong bearish tone, albeit price struggles to break its 200 EMA around current levels. Critical support stands at 0.9330 as buyers had defended it for these last weeks. A break below it exposes the pair to a slide down to 0.9260 strong static support zone.
Support levels: 0.9370 0.9330 0.9300
Resistance levels: 0.9420 0.9460 0.9500
Recommended Content
Editors’ Picks
EUR/USD declines below 1.0700 as USD recovery continues

EUR/USD lost its traction and declined below 1.0700 after spending the first half of the day in a tight channel. The US Dollar extends its recovery following the strong Unit Labor Costs data and weighs on the pair ahead of Friday's jobs report.
GBP/USD struggles to hold above 1.2500

GBP/USD turned south and dropped below 1.2500 in the American session on Thursday. The US Dollar continues to push higher following the Fed-inspired decline on Wednesday and doesn't allow the pair to regain its traction.
Gold slumps below $2,300 as US yields rebound

Gold extended its daily slide and dropped below $2,290 in the second half of the day on Thursday. The benchmark 10-year US Treasury bond yield erased its daily losses after US data, causing XAU/USD to stretch lower ahead of Friday's US jobs data.
Top 3 Price Prediction BTC, ETH, XRP: Altcoins to pump once BTC bottoms out, slow grind up for now

Bitcoin reclaiming above $59,200 would hint that BTC has already bottomed out, setting the tone for a run north. Ethereum holding above $2,900 keeps a bullish reversal pattern viable despite falling momentum. Ripple coils up for a move north as XRP bulls defend $0.5000.
Happy Apple day

Apple is due to report Q1 results today after the bell. Expectations are soft given that Apple’s Chinese business got a major hit in Q1 as competitors increased their market share against the giant Apple.