Auto strike drags markets down

USD: Sep '23 is Down at 104.910.
Energies: Oct '23 Crude is Up at 90.64.
Financials: The Dec '23 30 Year T-Bond is Down 9 ticks and trading at 118.10.
Indices: The Sep '23 S&P 500 emini ES contract is 20 ticks Higher and trading at 4503.00.
Gold: The Dec'23 Gold contract is trading Up at 1947.90. Gold is 17 ticks Higher than its close.
Initial conclusion
This is not a correlated market. The USD is Down and Crude is Up which is normal, and the 30 Year T-Bond is trading Lower. The Financials should always correlate with the US dollar such that if the dollar is Higher, then the bonds should follow and vice-versa. The S&P is Higher, and Crude is trading Higher which is not correlated. Gold is trading Higher which is correlated with the US dollar trading Down. I tend to believe that Gold has an inverse relationship with the US Dollar as when the US Dollar is down, Gold tends to rise in value and vice-versa. Think of it as a seesaw, when one is up the other should be down. I point this out to you to make you aware that when we don't have a correlated market, it means something is wrong. As traders you need to be aware of this and proceed with your eyes wide open. Asia is trading mainly Lower with the exception of the Shanghai and Nikkei exchanges which are Higher. Currently all of Europe is trading Lower.
Possible challenges to traders
-
NAHB Housing Market Index is out at 10 AM EST. This is Major.
-
TIC Long-Term Purchases is out at 4 PM EST. This is not Major.
Treasuries
Traders, please note that we've changed the Bond instrument from the 30 year (ZB) to the 10 year (ZN). They work exactly the same.
We've elected to switch gears a bit and show correlation between the 10-year bond (ZN) and the S&P futures contract. The S&P contract is the Standard and Poor's, and the purpose is to show reverse correlation between the two instruments. Remember it's likened to a seesaw, when up goes up the other should go down and vice versa.
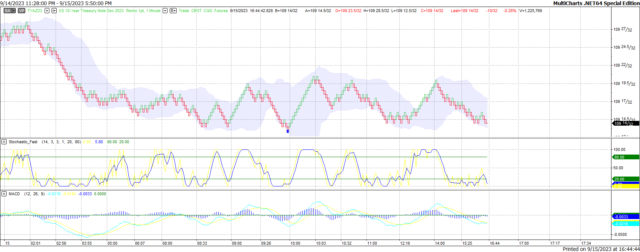
On Friday the ZN migrated Higher at around 10 AM EST as the S&P hit a High at around the same time. If you look at the charts below the S&P gave a signal at around 10 AM and the ZN started its Upward migration. Look at the charts below and you'll see a pattern for both assets. S&P hit a High at around 10 AM and migrated Lower. These charts represent the newest version of MultiCharts and I've changed the timeframe to a 15-minute chart to display better. This represented a Long opportunity on the 10-year note, as a trader you could have netted about a dozen plus ticks per contract on this trade. Each tick is worth $15.625. Please note: the front month for the ZN is now Dec '23. The S&P contract is now Dec' 23. I've changed the format to filled Candlesticks (not hollow) such that it may be more apparent and visible.
Charts Courtesy of MultiCharts built on an AMP platform
ZN - Dec 2023 - 9/15/23
-638306346194570278.png)
S&P - Dec 2023 - 9/15/23
Bias
On Friday, we gave the markets an Upside bias as both the USD and the Bonds were trading Lower Friday morning, and this usually represents an Upside Day. The markets however had other ideas as the Dow dropped 289 points and the other indices lost ground as well. Today we aren't dealing with a correlated market and our bias is to the Upside.
Could this change? Of Course. Remember anything can happen in a volatile market.
Commentary
We found out Thursday evening that the UAW (union for auto workers) was scheduled to go on strike as of midnight. There was still some time to midnight so we thought that perhaps a strike could be averted. A similar thing happened when Clinton was President, but he averted a nationwide strike. This President wasn't so fortunate as the UAW did go on strike and the markets dropped on this news. There was a time when almost all manufacturing centered around the automakers as their suppliers alone employ millions and any slowdown could seriously hurt this economy. Hence the downfall on Friday. We don't have any real economic news to report today so this could drag the markets another day but we'll need to monitor.
Author

Nick Mastrandrea
Market Tea Leaves


