AUD/USD ticks down below 0.6900, WTI oil futures trade with bearish bias [Video]
![AUD/USD ticks down below 0.6900, WTI oil futures trade with bearish bias [Video]](https://editorial.fxstreet.com/images/Markets/Currencies/Majors/AUDUSD/hundred-bucks-3645622_XtraLarge.jpg)
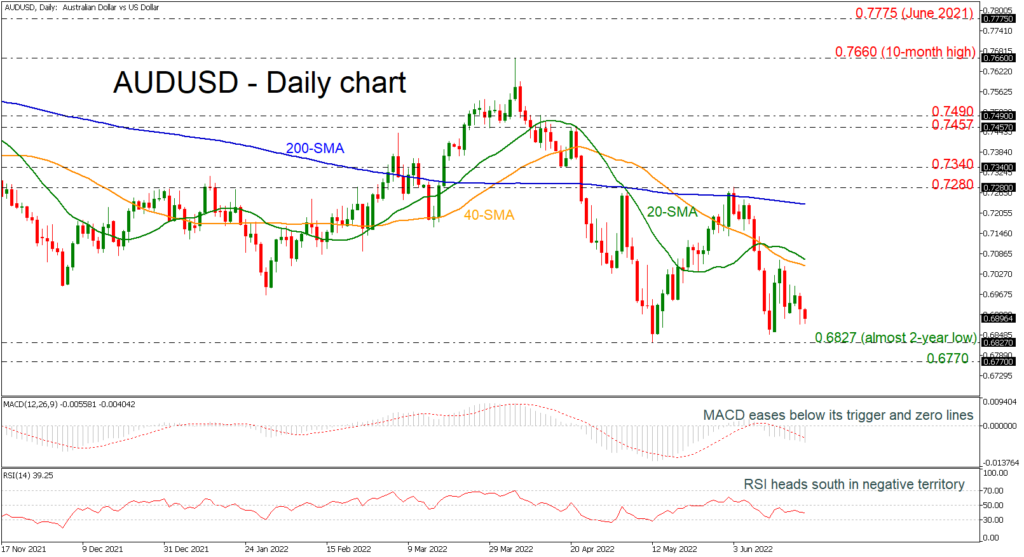
AUD/USD ticks down below 0.6900, next support at 2-year low
AUDUSD has been underperforming over the last week as it failed to surpass the short-term simple moving averages (SMAs). The price is currently diving beneath the 0.6900 round number, and it appears ready to retest the almost two-year low of 0.6827. Even lower, the market may find strong support near the 0.6770 level, taken from the low in June 2020. Breaking these obstacles, traders may take the pair until the April 2020 inside swing high at 0.6570, confirming the long-term bearish outlook.
Turning to the technical indicators, the MACD oscillator is moving lower below its trigger and zero lines, while the RSI indicator is losing some momentum in the negative region.
If the market corrects higher, the bullish action may pause initially near 20- and 40-day SMAs around the 0.7060 before attention shifts to the 200-day SMA at 0.7234. A rally on top of the latter and, more importantly above the 0.7280 would probably generate fresh buying pressure, with the price moving next to the 0.7340 resistance and then towards 0.7457.
In brief, AUDUSD is bearish in the short- and medium-term timeframes and only a climb beyond the 200-day SMA may change this outlook to bullish.
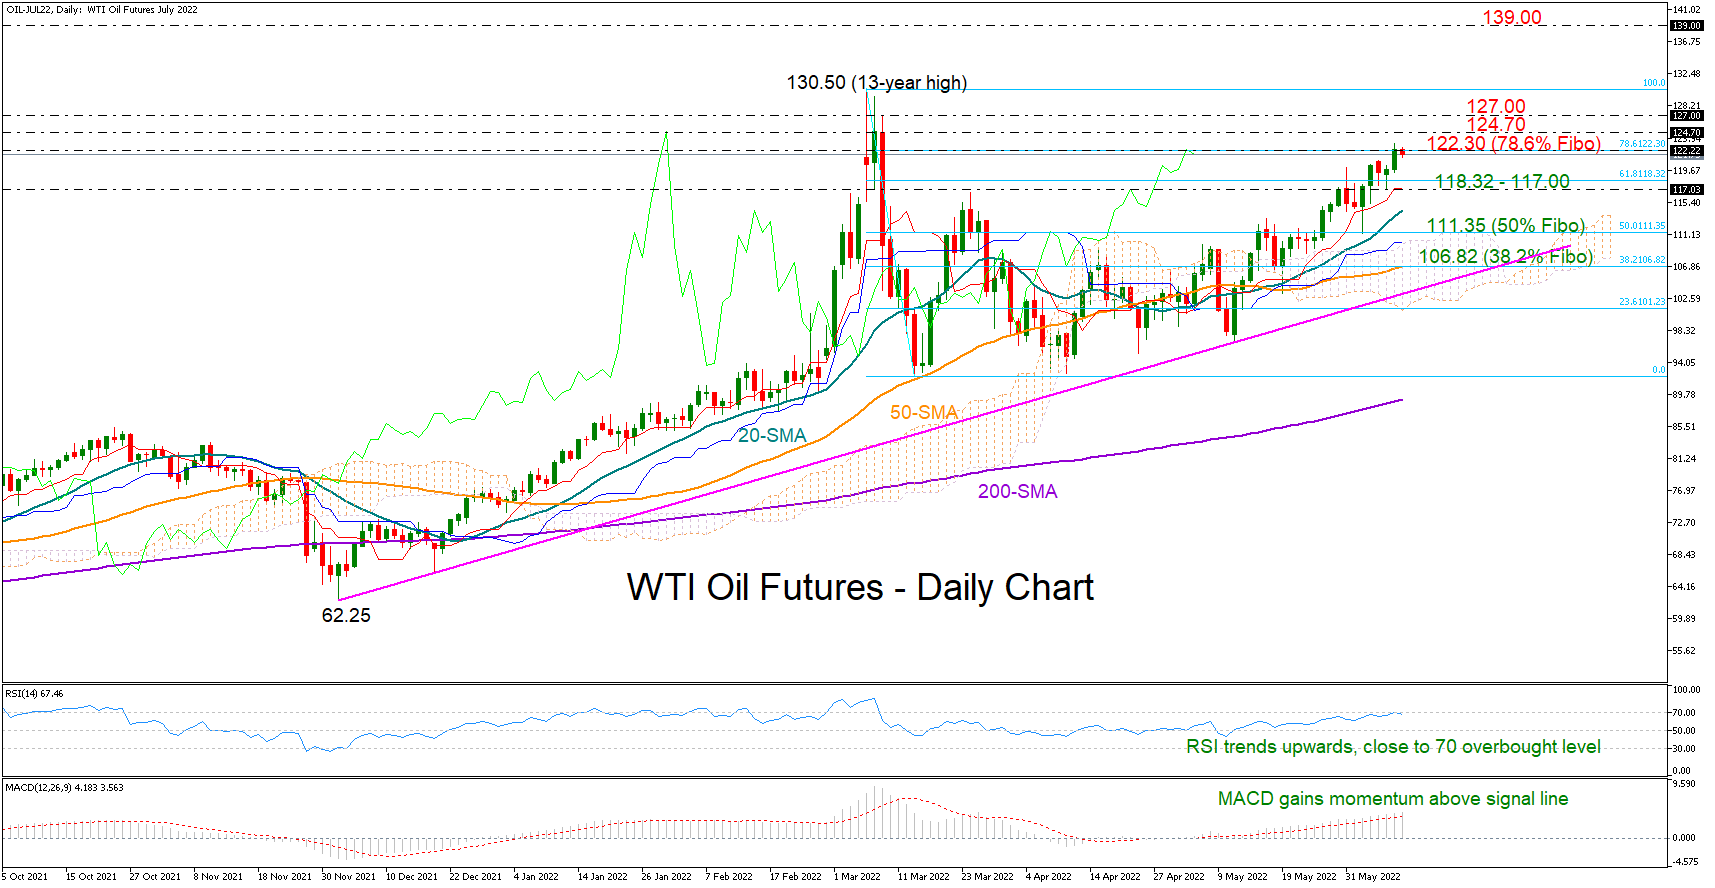
WTI oil futures trade with bearish bias as trendline breached
WTI oil futures (August delivery) lost almost 5% on Wednesday, tumbling to a six-week low of $101.53 before closing the day off its lows.
The bearish action breached the support trendline, which joined the lows from December’s bottom of $62.25, sending a warning signal that selling tendencies may escalate in the coming sessions. The clear negative trend in the RSI and the MACD, which have dipped back in the bearish area, is backing this narrative too.
That said, there is another shorter-term ascending trendline from April, which is still valid at $102.43, while the 23.6% Fibonacci retracement of the $130.50 – $92.19 downfall at 101.23 is adding extra importance to the region. Hence, sellers may wait for a decisive close below those obstacles before they aggressively squeeze the price towards the previous trough of $96.90. Then, all eyes will turn to the bottom of the three-month-old range area at $92.19. Notably, the 200-day simple moving average (SMA) is approaching the same territory. However, if it proves fragile, the decline could stretch towards the crucial constraining zone of $87.50 – $85.00.
Shifting to the upside, the price will need to crawl above the $108.85 – $111.35 region to retest the 20-day SMA and the $114.50 constraining zone. Higher, the $118.32 mark could reinforce some consolidation before the door opens for June’s high of $120.87.
Summarizing, WTI oil futures may remain under pressure in the short-term. A significant move below $101.23 could to set the stage for another sharp decline towards $96.90.
Author

Christina joined the XM investment research department in May 2017. She holds a master degree in Economics and Business from the Erasmus University Rotterdam with a specialization in International economics.


