AUD/USD Price Forecast: Tough barrier stands around 0.6950
- AUD/USD resumed its weekly downtrend and broke below 0.6900.
- The greenback maintained its bullish performance unchanged.
- Activity in Australia’s Services sector remained healthy in September.

AUD/USD saw its selling bias gather extra steam on Thursday. That said, the pair broke below the key 0.6900 support to hit new multi-day lows near 0.6830.
The renewed downward trend in the Aussie Dollar mirrored the performance of its risk-related peers, all against the backdrop of the intense recovery in the US Dollar (DXY), which remained propped up by auspicious results from data releases as well as geopolitical effervescence in the Middle East.
Collaborating with the sour sentiment around the commodity complex, copper prices resumed their weekly drop, while iron ore prices traded with humble losses, although keeping the upper end of the recent range. Furthermore, the recently announced stimulus measures in China, particularly those relating to its housing sector, should help iron ore prices keep their upside bias.
On the monetary front, the Reserve Bank of Australia (RBA) kept its rates unchanged at 4.35% during its September 24 meeting, as expected. While the RBA acknowledged inflation risks, Governor Michele Bullock signalled that a rate hike was not seriously considered.
Markets currently anticipate a 55% chance of a 25-basis-point rate cut by the end of the year.
In fact, the RBA is expected to be among the last of the G10 central banks to reduce rates, possibly cutting later this year to counter weak economic activity and cooling inflation pressures.
While Federal Reserve rate cuts are already factored in, AUD/USD could experience further gains in 2024, though concerns about China’s economic outlook and stimulus measures remain.
On the domestic calendar, the final Judo Bank Services PMI remained in the expansionary ground at 50.5 in September. It is worth noting that the index has been above 50 since March 2022.
AUD/USD daily chart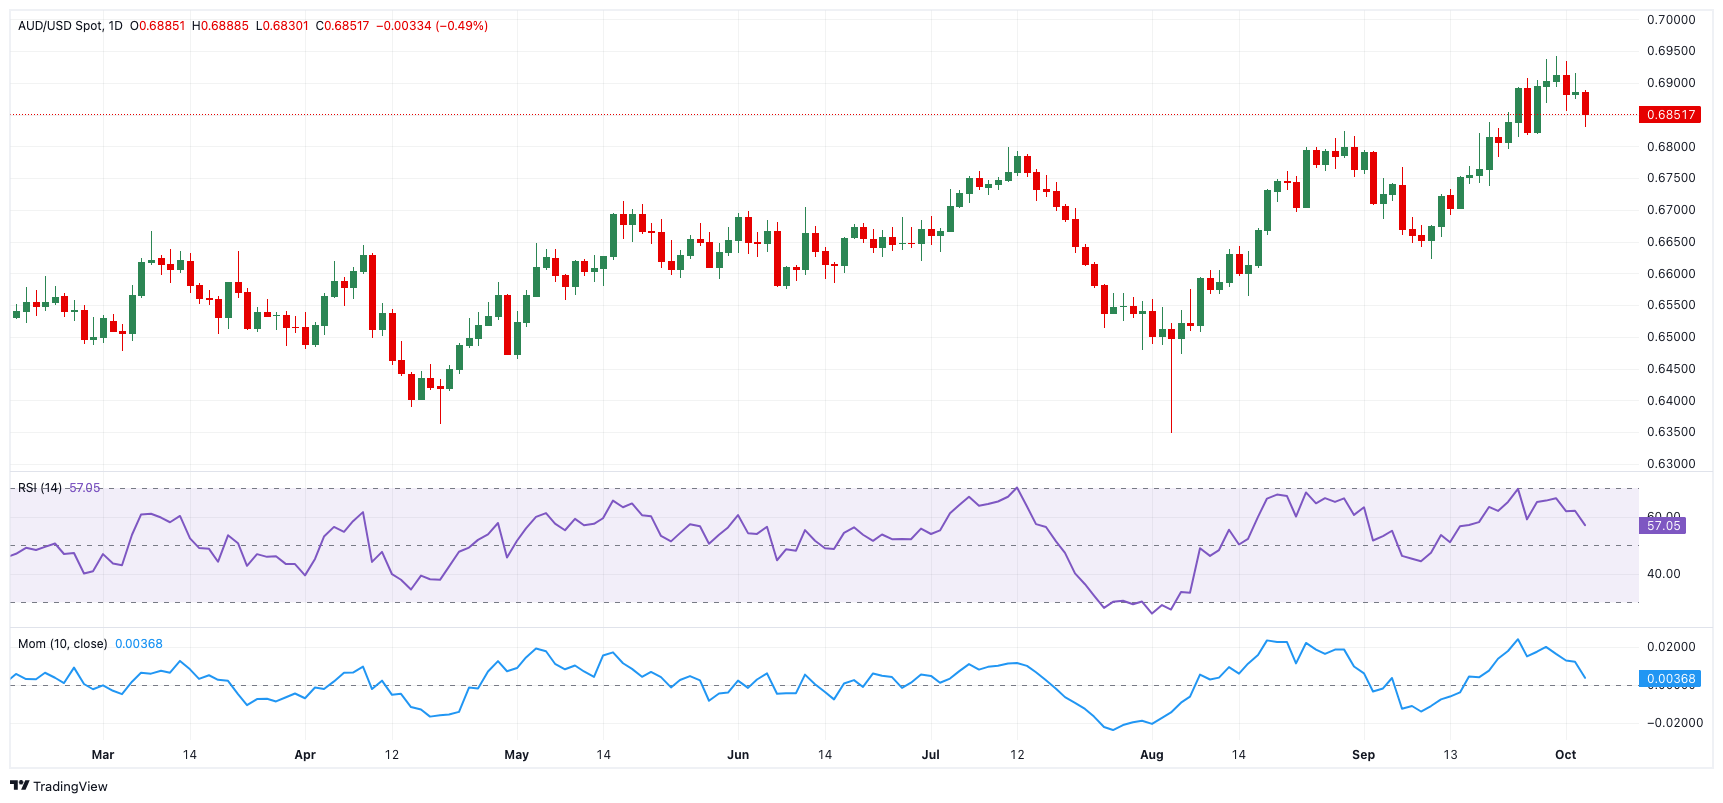
AUD/USD short-term technical outlook
Extra losses could see AUD/USD drop to the interim 55-day and 100-day SMAs at 0.6699 and 0.6685, respectively, prior to the September low of 0.6622 (September 11), which is supported by the key 200-day SMA (0.6626).
On the upside, the initial barrier comes at the 2024 peak of 0.6942 (September 30) before the key 0.7000 hurdle.
The four-hour chart suggests some resurgence of the bearish trend. Having stated that, the initial support is 0.6915 ahead of 0.6942, and then 0.7024. On the downside, the initial support is 0.6829, followed by 0.6817. The RSI eased to nearly 40.
Premium
You have reached your limit of 3 free articles for this month.
Start your subscription and get access to all our original articles.
Author

Pablo Piovano
FXStreet
Born and bred in Argentina, Pablo has been carrying on with his passion for FX markets and trading since his first college years.


