AUD/USD Price Forecast: Next on the downside now comes the 2024 low
- AUD/USD deepened its weekly pullback and broke below 0.6500.
- Further gain saw the US Dollar flirt with yearly peaks on Wednesday.
- The release of the labour market report in Oz takes centre stage.

The US Dollar’s upward momentum continued on Wednesday, pushing the Dollar Index (DXY) to levels just shy of the 2024 top around 106.50. In contrast, the Australian Dollar (AUD) struggled, sinking below 0.6500 and extending further its recent breakdown of its 200-day Simple Moving Average (SMA) of 0.6628, signaling potential further downside.
The Aussie’s weakness was exacerbated by extra losses in copper and iron ore prices, along with the broader pullback in commodities’ prices. China’s economic data published over the weekend added to the pressure, revealing the slowest pace of consumer price growth in four months, heightening concerns over deflation and casting doubt on recent stimulus efforts.
Domestically, the Reserve Bank of Australia (RBA) left rates unchanged at 4.35% in its November 5 meeting, in line with initial estimates. The RBA acknowledged gradual progress toward its inflation target but adjusted its growth outlook slightly lower. Governor Michele Bullock’s comments indicated that the current interest rate level remains appropriate, with traders now eyeing a potential rate cut in May 2025.
Australia’s latest inflation data showed signs of easing, with September’s CPI cooling to 2.1%, and Q3’s annual rate at 2.8%. While a possible Federal Reserve rate cut could support AUD/USD, persistent inflationary risks—especially under a potential Trump administration—could keep the US Dollar strong, limiting any upside for the pair. Furthermore, lingering concerns over China’s economy may continue to weigh on the Aussie.
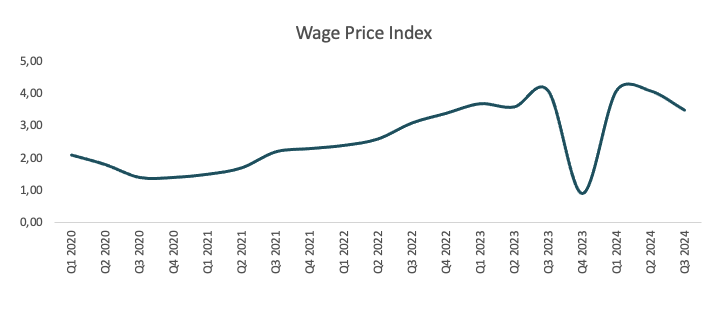
Data wise, Down Under, the Wage Price Index rose by 0.8% QoQ in the July-September period and 3.5% on a yearly basis.
AUD/USD daily chart
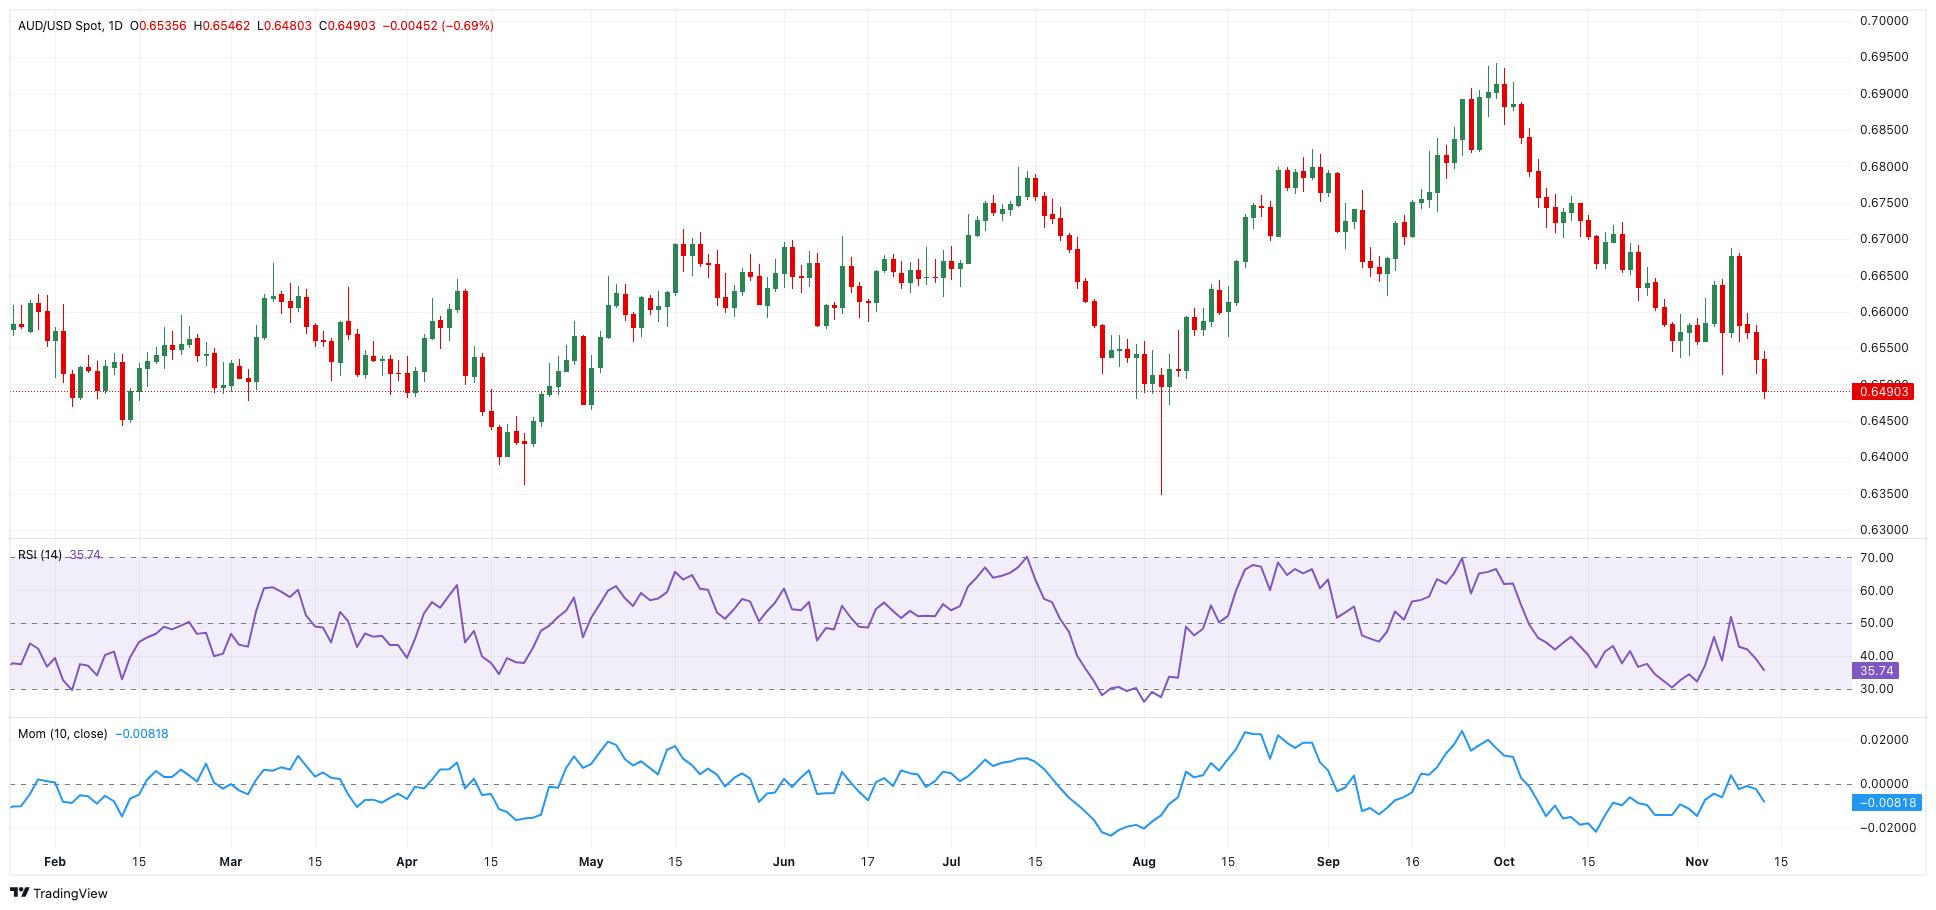
AUD/USD short-term technical outlook
If sellers retain control, the next point of contention is the November low of 0.6479 (November 13), which comes before the 2024 bottom of 0.6347 (August 5).
On the upside, the AUD/USD should encounter initial resistance at the 200-day SMA of 0.6628 prior to the November top of 0.6687 (November 7), which is supported by the provisional 100-day SMA.
The four-hour chart shows a continuation of the negative trend. That said, initial support comes at 0.6479, followed by 0.6347. On the plus side, the immediate challenge is the 55-SMA at 0.6585, which comes before the 100-SMA 0.6597. The RSI dropped to around 28, entering the oversold zone.
Premium
You have reached your limit of 3 free articles for this month.
Start your subscription and get access to all our original articles.
Author

Pablo Piovano
FXStreet
Born and bred in Argentina, Pablo has been carrying on with his passion for FX markets and trading since his first college years.


