AUD/USD Price Forecast: Further decline remains likely
- AUD/USD broke below the 0.6600 level, opening the door to extra losses.
- The US Dollar traded amidst an inconclusive range near recent highs.
- The pair breached the key 200-day SMA, exposing further weakness.

AUD/USD remained under pressure at the beginning of the week, adding to Friday’s retracement to print new lows near 0.6580 and extending the recent breakdown of the critical 200-day simple moving average (SMA), currently at 0.6627.
Despite the US Dollar's (USD) subdued performance, which saw mild losses against the backdrop of an equally tepid recovery in risk assets, the Australian dollar struggled in response to lingering doubts over the effectiveness of China’s recently announced stimulus measures.
Further gains in copper prices in combination with another marginal uptick in iron ore prices further underscored the market’s mixed sentiment about China’s economic outlook and did nothing to curb the selling sentiment hurting the Aussie Dollar.
On the monetary policy front, the Reserve Bank of Australia (RBA) held its cash rate steady at 4.35% during its September meeting. While Governor Michele Bullock acknowledged inflationary risks, she downplayed the possibility of a rate hike in the near term.
Later, meeting Minutes revealed a more dovish tone than in August, suggesting rates might hold steady for now. Market sentiment indicates a 50% chance of a 25-basis-point rate cut by year-end, with expectations that the RBA may be one of the last G10 central banks to ease rates as growth and inflation cool.
However, in his latest remarks, Deputy Governor Andrew Hauser warned that expectations for substantial RBA rate cuts may be overestimated. He noted that the neutral rate is estimated between 3% and 4%, implying that the current rate of 4.35% is not overly restrictive.
While potential rate cuts by the Federal Reserve later this year could offer some support to AUD/USD, uncertainties surrounding China’s economic trajectory are expected to weigh heavily on the pair.
In Oz, the next relevant release will be the RBA’s Monthly CPI Indicator, along with the Inflation Rate for the third quarter, all expected on October 30.
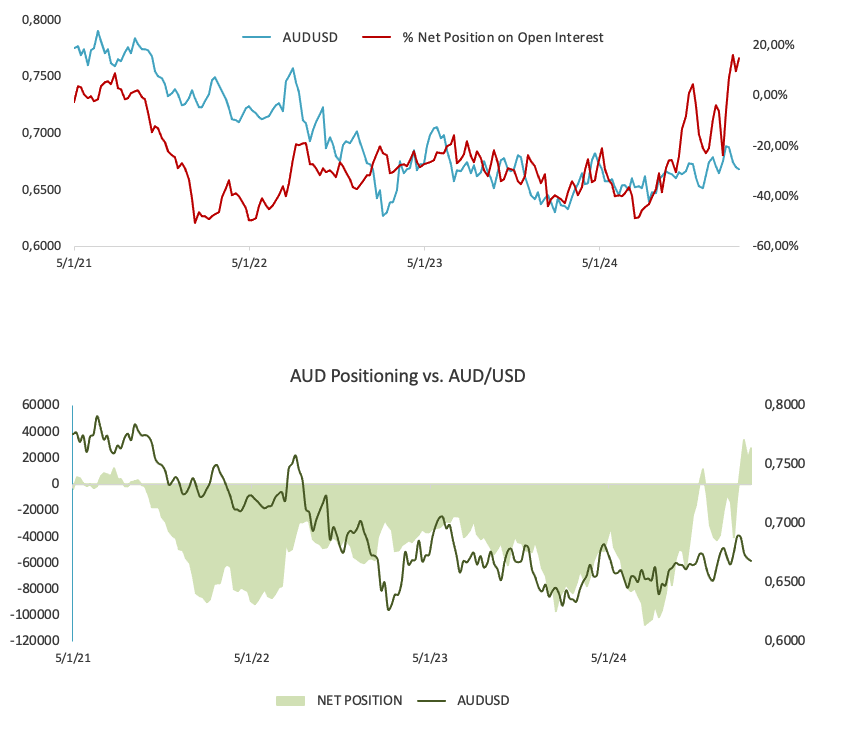
On the positioning front, speculative net longs in AUD rose to two-week tops in the week ending October 22, according to the CFTC Positioning Report. In addition, open interest retreated for the second week in a row. During that period, AUD/USD navigated a consolidative range above the 0.6650 zone, although always keeping close track of developments around China and the implementation of its stimulus packages.
AUD/USD daily chart
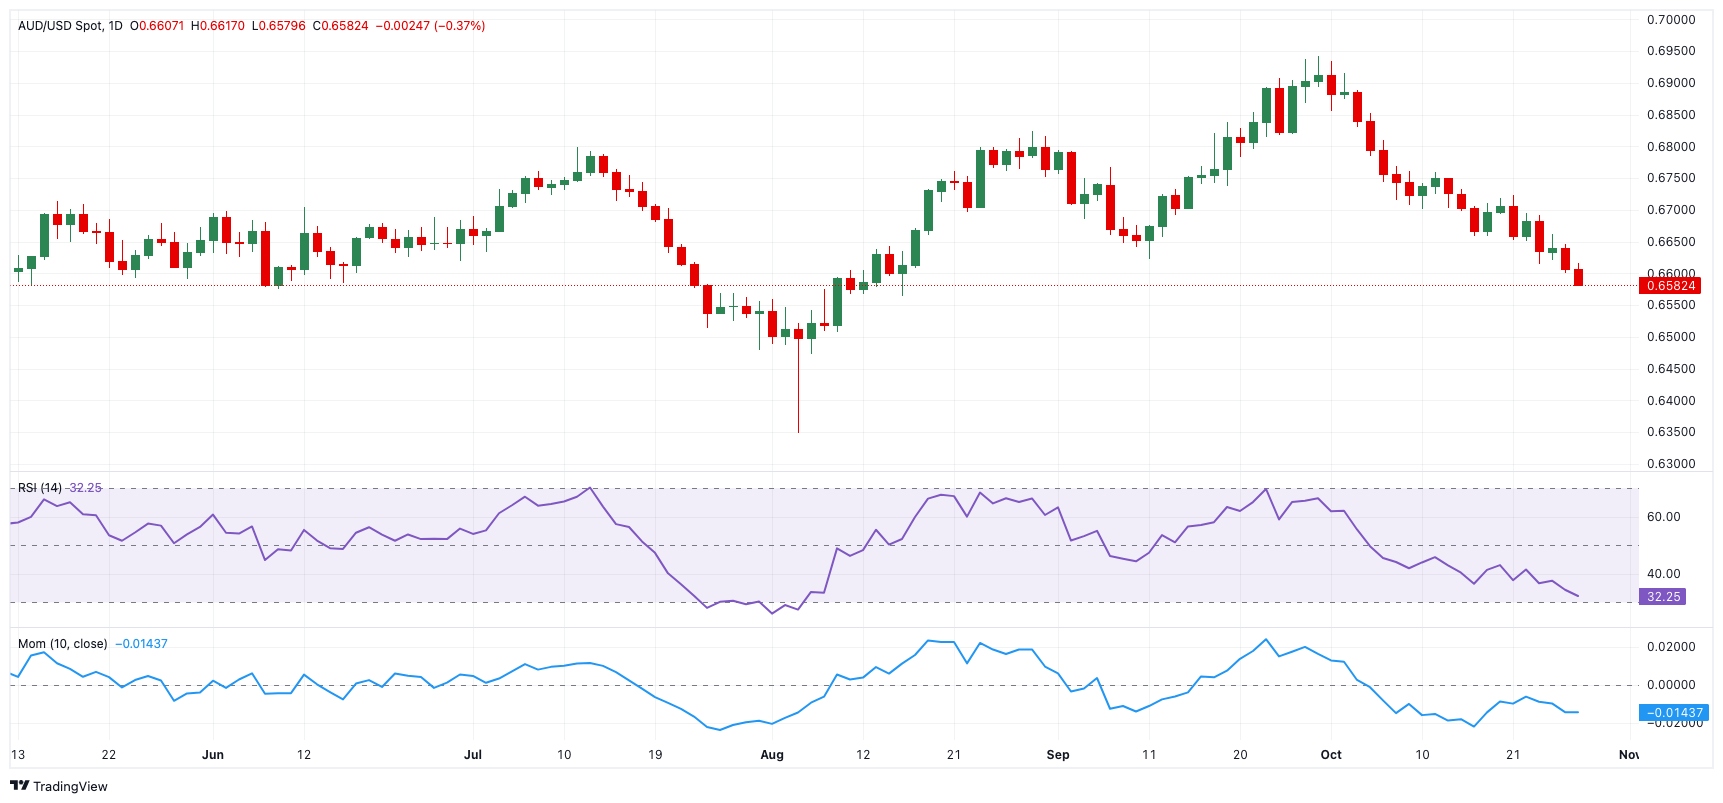
AUD/USD short-term technical outlook
Extra losses might send the AUD/USD to its October low of 0.6579 (October 28), ahead of the 2024 low of 0.6347 (August 5).
On the upside, there is an intermediate resistance at the 100-day and 55-day SMAs of 0.6694 and 0.6740, respectively, before hitting the 2024 top of 0.6942 (September 30) and the critical 0.7000 barrier.
The four-hour chart shows that the negative leg continues in place. That said, initial support is at 0.6579, followed by 0.6347. On the upside, the initial resistance level is the 55-SMA at 0.6661, followed by 0.664 and then 0.6723. The RSI decreased to about 33.
Premium
You have reached your limit of 3 free articles for this month.
Start your subscription and get access to all our original articles.
Author

Pablo Piovano
FXStreet
Born and bred in Argentina, Pablo has been carrying on with his passion for FX markets and trading since his first college years.


