AUD/USD Price Forecast: First resistance emerges around 0.6650
- AUD/USD came under renewed downside pressure near 0.6650.
- Weaker commodity prices hurt the Aussie Dollar on Wednesday.
- Next on tap Down Under will be the jobs report on Thursday.

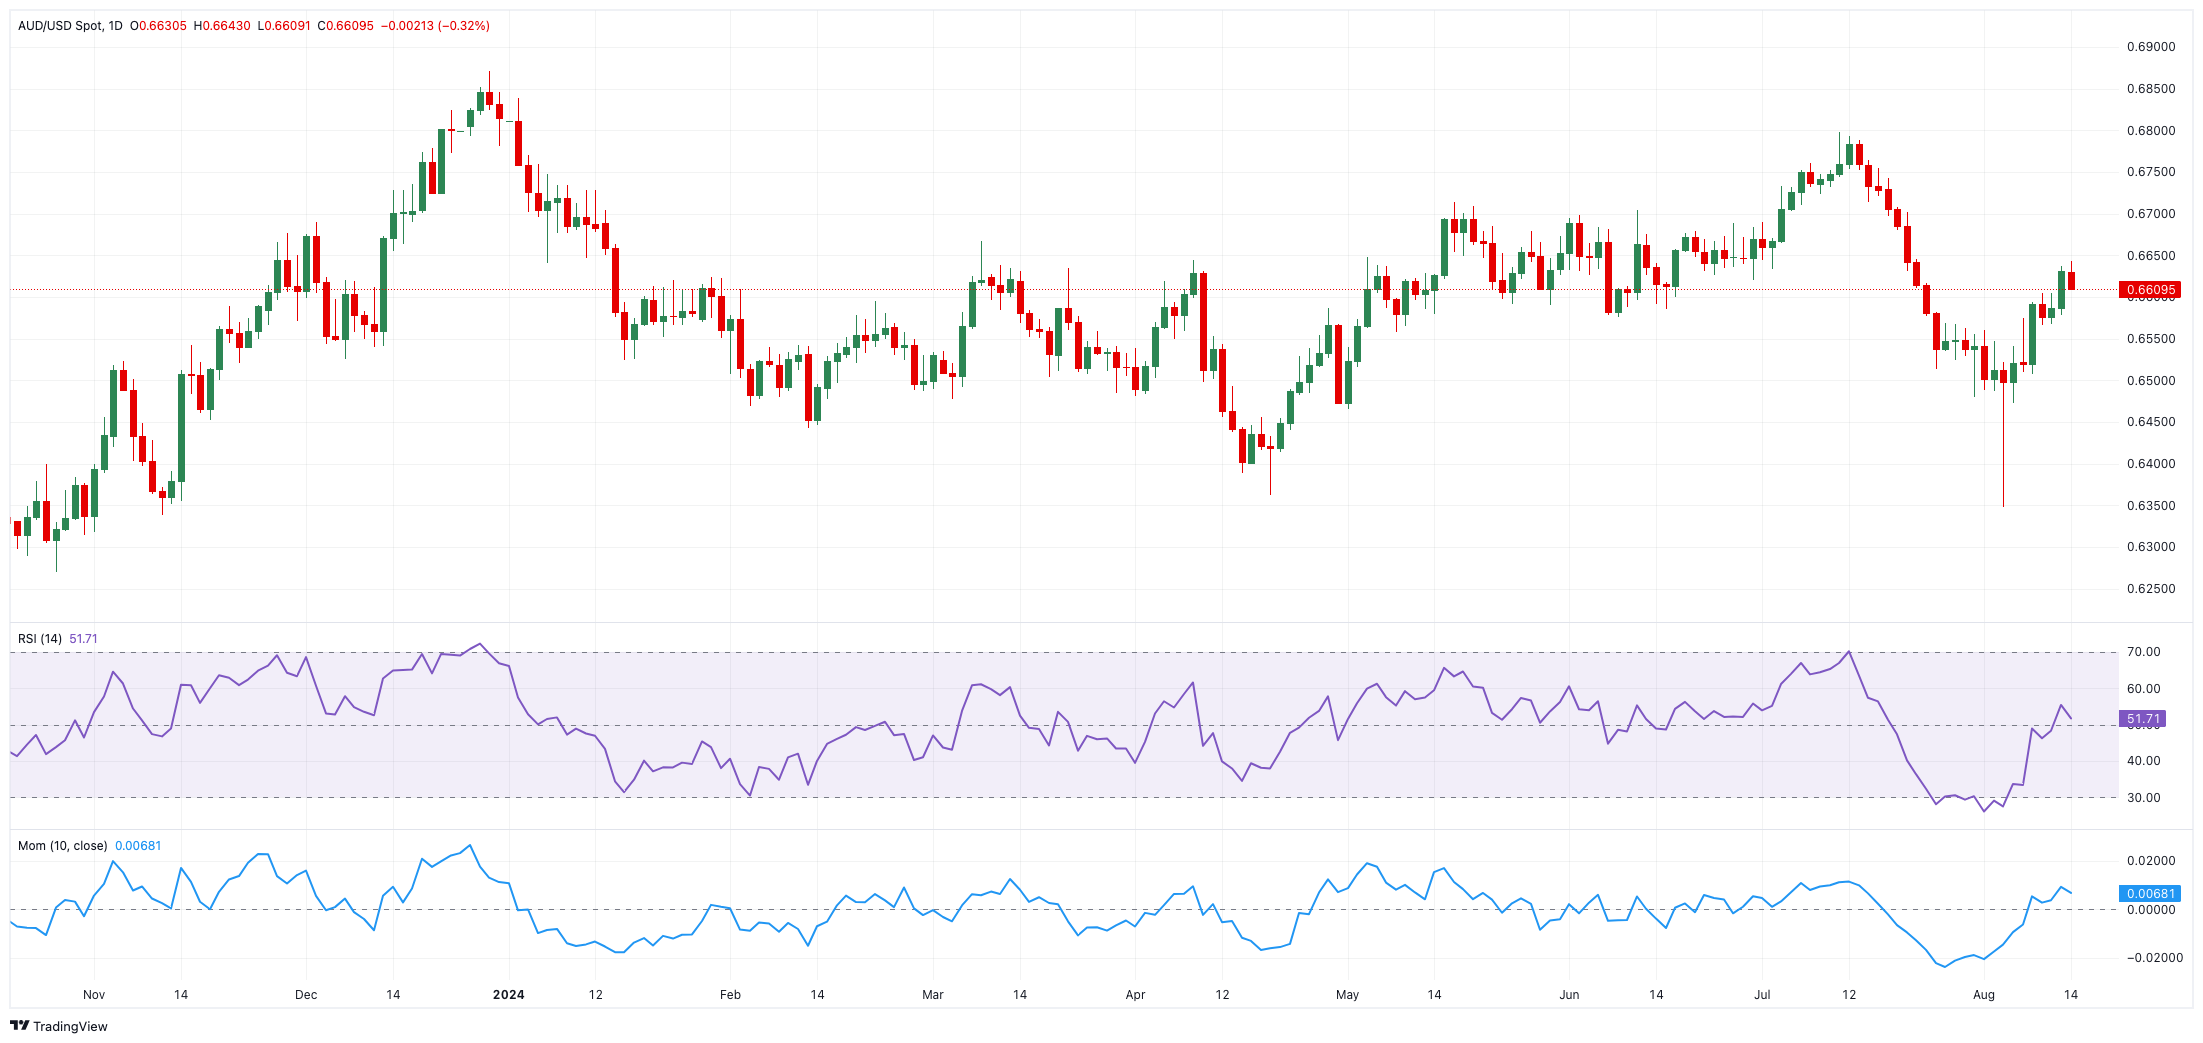
AUD/USD’s upward trend appears to have struggled around the 0.6650 zone so far, a region also coincident with the temporary 55-day SMA and close to the 61.8% Fibo retracement of the July-August steep sell-off. That said, spot traded on the defensive after two consecutive daily advances on Wednesday.
After breaking through the key 200-day SMA (0.6597), the outlook for AUD/USD is expected to gradually become more favourable, potentially supporting the continuation of the uptrend, at least in the short term.
The pair's retracement on Wednesday came despite further losses in the US Dollar, and seems to have exclusively followed extra weakness in the commodity complex, where prices of both copper and iron ore edged lower. On the latter, futures dropped to their lowest level in over a year as disappointing credit data from China, the largest consumer, further weighed on market sentiment already affected by weakening demand and high supply.
Shifting the view to monetary policy, investor confidence in the Australian dollar was bolstered as of late by the Reserve Bank of Australia's (RBA) recent decision to keep the official cash rate (OCR) steady at 4.35%. The RBA emphasized its cautious stance, indicating no rush to ease policy, with domestic inflation expected to remain persistent. Both trimmed-mean and headline CPI inflation are now projected to reach the midpoint of the 2-3% range by late 2026, later than the previously anticipated June 2026.
During her press conference, RBA Governor Michele Bullock mentioned that the Board had considered a rate hike and stressed that rate cuts are not on the horizon, noting that expectations for cuts are premature.
Governor Bullock reiterated in her latest comments that the bank would not hesitate to raise interest rates if necessary to control inflation, maintaining a hawkish stance as underlying inflation remains high. She highlighted the bank's vigilance regarding inflation risks following the decision to keep rates unchanged. Core inflation, which was 3.9% last quarter, is expected to fall to the target range of 2% to 3% by late 2025.
Overall, the RBA is likely to be the last among the G10 central banks to start cutting interest rates. Potential easing by the Federal Reserve (Fed) in the medium term, contrasted with the RBA's expected prolonged restrictive stance, could provide support to the AUD/USD in the coming months.
However, the sluggish performance of the Chinese economy could hinder a sustained recovery of the Australian dollar. China continues to face post-pandemic challenges, including deflation and inadequate stimulus for a strong recovery. Concerns about demand from China, the world's second-largest economy, also arose following the Politburo meeting, where, despite pledges to support the economy, no specific new stimulus measures were introduced.
Notably, Chinese inflation data showed a slight increase in July, both in monthly and yearly CPI figures, while Producer Prices also came in slightly above estimates.
Meanwhile, non-commercial traders (speculators) remained largely net-short on the AUD, according to the latest report from the CFTC, mainly due to the lack of positive signals from China. Aside from a brief two-week interruption, net shorts have dominated since Q2 2021.
AUD/USD daily chart
AUD/USD short-term technical outlook
Further gains should propel the AUD/USD towards the August top of 0.642 (August 14), ahead of the July peak of 0.6798 (July 8) and the December high of 0.6871.
Occasional bearish swings, on the flip side, may spark a drop to the 2024 bottom of 0.6347 (August 5) before sliding to the 2023 low of 0.6270 (October 26).
The four-hour chart indicates a slight loss of upside momentum for the time being. However, the immediate obstacle is at 0.6642, ahead of 0.6702. On the other hand, the 100-SMA of 0.6554 provides early support, followed by 0.6347. The RSI dropped to approximately 55.
Author

Pablo Piovano
FXStreet
Born and bred in Argentina, Pablo has been carrying on with his passion for FX markets and trading since his first college years.

















