AUD/USD Price Forecast: Extra rebound hinges on USD
- AUD/USD kept the upside traction in place and added to Wednesday’s gains.
- The Dollar remained on the back foot on further easing of the labour market.
- Australia’s trade surplus widened to more than A$6.0B in July.

The US Dollar (USD) maintained its bearish mood and added to losses recorded in the previous day, boosting risk-linked assets and allowing AUD/USD to rebound past 0.6700 the figure on Thursday.
Despite a strong drop seen earlier in the week, the Australian Dollar maintained its positive outlook, supported by the key 200-day SMA at 0.6615. This optimistic view, however, was threatened by the recent strengthening of the USD and ongoing concerns about China's economic prospects.
The daily rebound in AUD/USD was supported by a decent recovery in both copper and iron ore prices. On the latter, continuing weakness in iron ore prices is likely to limit further gains for the AUD, given their direct correlation with China's economic activity.
Recent monetary policy shifts have also supported the Australian Dollar's upward momentum. The Reserve Bank of Australia (RBA) recently kept the Official Cash Rate (OCR) at 4.35%, taking a cautious stance amid ongoing inflationary pressures with no immediate signs of easing.
Further confidence in the AUD was driven by a hawkish tone in the latest RBA Minutes, which highlighted debates among members on whether to increase the cash rate target. The minutes highlighted ongoing inflationary pressures and market expectations of potential rate cuts in late 2024.
Still around the RBA, Governor Michelle Bullock maintained the bank's hawkish stance on Wednesday, cautioning about the dangers of high inflation. She reiterated that if the economy develops as expected, the Board does not foresee being in a position to cut rates in the near term.
Despite this, RBA cash rate futures still indicate a high likelihood of around 85% of a 25 bps cut by year end.
All in all, the RBA is expected to be the last among G10 central banks to begin cutting rates.
However, with almost fully priced-in rate cuts from the Federal Reserve (Fed) on the horizon and the RBA likely to maintain a restrictive policy for an extended period, AUD/USD could see further gains in the latter part of the year.
Nonetheless, the Australian Dollar's gains may be limited by the glacial-paced recovery of the Chinese economy. Deflation and insufficient stimulus measures are hindering China’s post-pandemic recovery. The latest Politburo meeting, while showing support, did not announce any significant new stimulus measures, raising concerns about demand from the world's second-largest economy.
Meanwhile, the latest CFTC report for the week ending August 27 showed that speculators remained net short on the AUD, although their positions were halved from the previous week. The AUD has been in net-short territory since Q2 2021, with only a brief two-week exception earlier this year.
On the economic data side, Australia's trade surplus widened to A$6.009B in July, with exports up 0.7% MoM and imports down by 0.8% MoM.
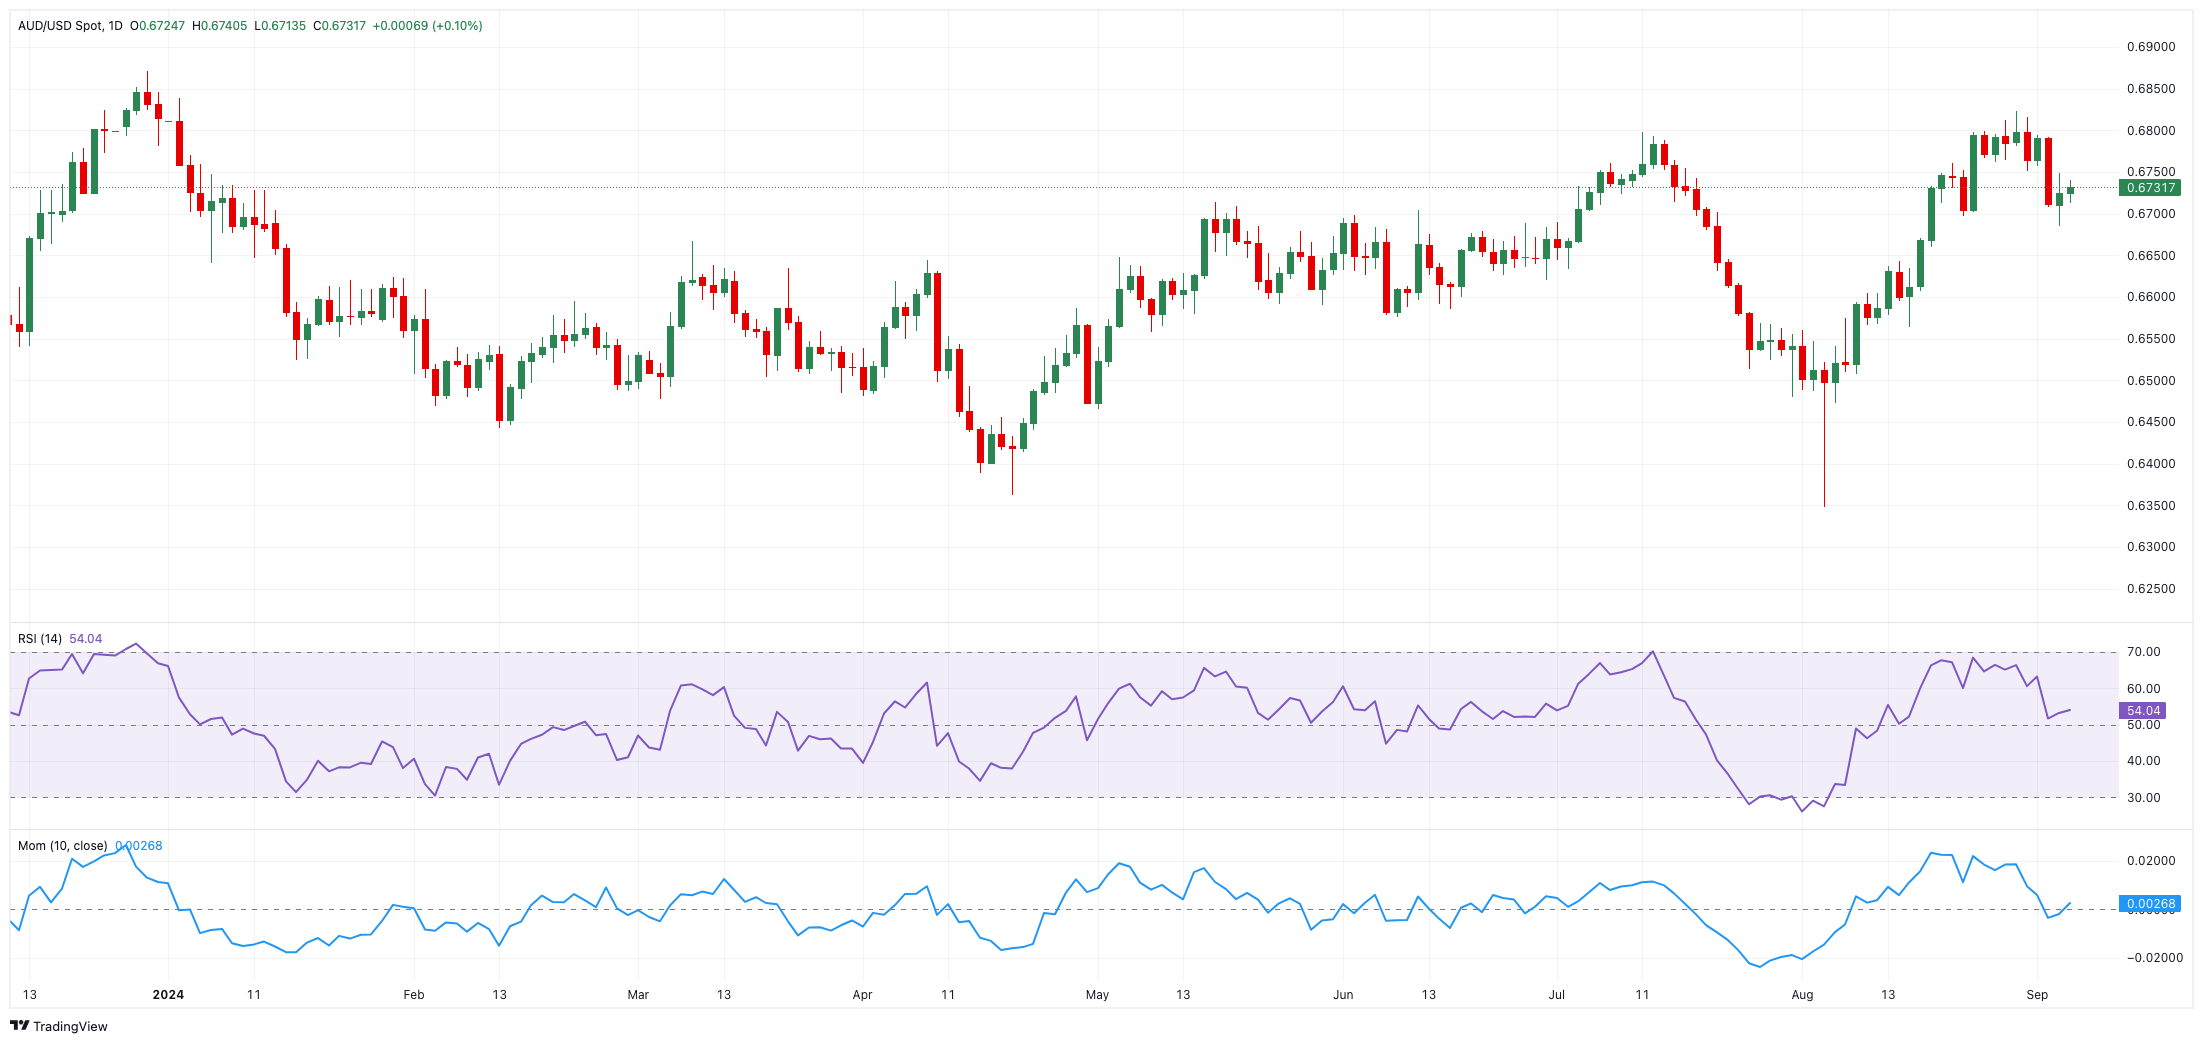
AUD/USD daily chart
AUD/USD short-term technical outlook
Further rises are likely to bring the AUD/USD to its August high of 0.6823 (August 29), then to the December 2023 top of 0.6871 (December 28), and finally to the key 0.7000 yardstick.
Sellers, on the other hand, may initially drive the pair to its September low of 0.6685 (September 4), which is prior to the temporary 55-day SMA of 0.6667 and the key 200-day SMA of 0.6615.
The four-hour chart shows a gradual restoration of the upward bias. Nonetheless, the immediate resistance level is the 55-SMA at 0.6766, followed by 0.6823, which comes before 0.6871. On the other side, the initial support level is 0.6685, which is followed by the 200-SMA at 0.6643 and then 0.6560. The RSI hovered around 45.
Author

Pablo Piovano
FXStreet
Born and bred in Argentina, Pablo has been carrying on with his passion for FX markets and trading since his first college years.
















