AUD/USD Price Forecast: A move to 0.7000 appears on the horizon
- AUD/USD clinched fresh tops beyond the 0.6900 barrier.
- The Dollar’s late rebound prompted AUD to give away initial gains.
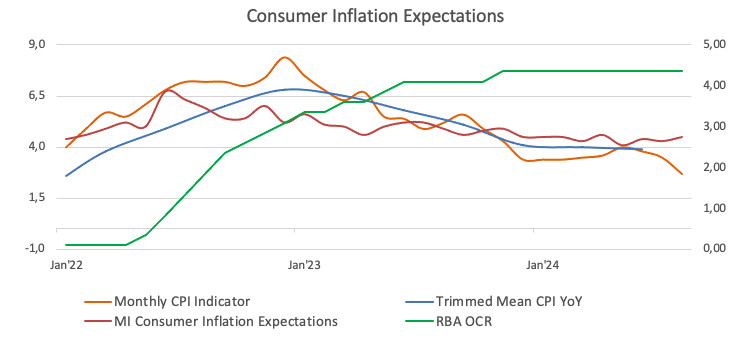
- The RBA’s Monthly CPI Indicator eased to 2.7% in August.

On Wednesday, the late rebound of the US dollar (USD) motivated the risk-associated assets to fade initial gains, forcing AUD/USD to retreat from earlier peaks north of the 0.6900 hurdle, a region last visited in late February 2023.
It is worth recalling that the Aussie Dollar rose in the last couple of sessions, propelled by news of further stimulus by the PBoC.
In the meantime, the Greenback met support near yearly lows around 100.20, sparking quite a marked comeback and revisiting the 100.80 zone when gauged by the US Dollar Index (DXY).
The daily retracement in the pair also came in tandem with extra recovery in copper prices and iron ore prices, all supported by firm expectations of Chinese stiumulus.
Meanwhile, the Reserve Bank of Australia (RBA) kept rates steady at 4.35%, as anticipated, at its September 24 gathering. The bank maintained its neutral guidance, stating that “the Board is not ruling anything in or out,” while cautioning that “it will be some time yet before inflation is sustainably in the target range” and emphasizing “the need to remain vigilant to upside risks to inflation.”
However, during her post-meeting press conference, Governor Michele Bullock softened the hawkish tone, confirming that the Board “didn’t explicitly consider a rate hike this time.”
So far, investors see a nearly 55% chance of a 25 basis point cut by year end.
Meanwhile, the RBA could be among the last G10 central banks to begin cutting rates. It is expected to join the global easing cycle later this year, as weak underlying economic activity points to lower inflation pressures.
Looking ahead, with the Federal Reserve's anticipated rate cuts largely factored in and the RBA likely to keep a restrictive stance for some time, the AUD/USD may see further improvement later this year.
However, a big question mark surrounds the Chinese economy, as uncertainty remains high regarding the likelihood that the country could materialize the recently announced set of stimulus.
On the domestic calendar, the RBA’s Monthly CPI Indicator came in at 2.7% in August, from 3.5%. On this, it is worth remembering that Governor Bullock downplayed the significance of the this release, noting it is “quite volatile” and does not capture all items like the quarterly CPI data. The RBA also reiterated that it does not foresee inflation returning “sustainably” to the 2-3% target range until 2026.
AUD/USD daily chart
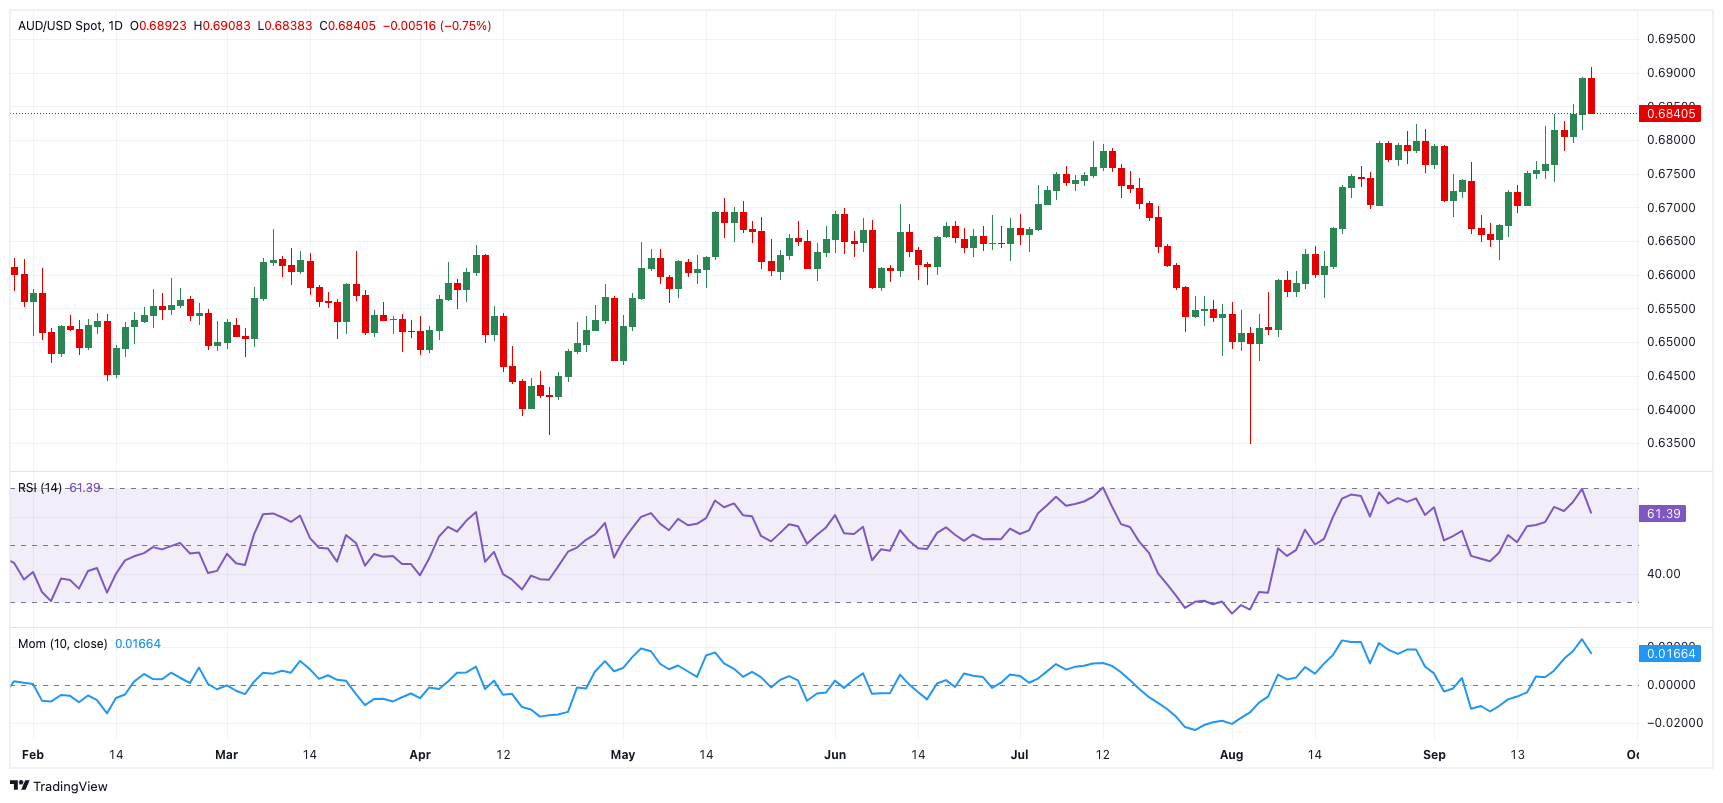
AUD/USD short-term technical outlook
Further increases are likely to take the AUD/USD to the 2024 high of 0.6908 prior to the important 0.7000 level.
Sellers, on the other hand, may initially pull the pair to its September low of 0.6622 (September 11), which is supported by the key 200-day SMA, all before the 2024 bottom of 0.6347 (August 5).
The four-hour chart indicates some loss of momentum of the positive feeling. That being said, the initial resistance is 0.6908, ahead of 0.6920 and 0.7024. On the downside, early support comes from the 55-SMA at 0.6789, followed by the 100-SMA at 0.6746, and ultimately 0.6692. The RSI hovered around 50.
Premium
You have reached your limit of 3 free articles for this month.
Start your subscription and get access to all our original articles.
Author

Pablo Piovano
FXStreet
Born and bred in Argentina, Pablo has been carrying on with his passion for FX markets and trading since his first college years.


