AUD/USD Forecast: Upside momentum lacks conviction
- AUD/USD finally surpassed the 0.6500 barrier.
- The rebound in the Greenback weighed on the pair.
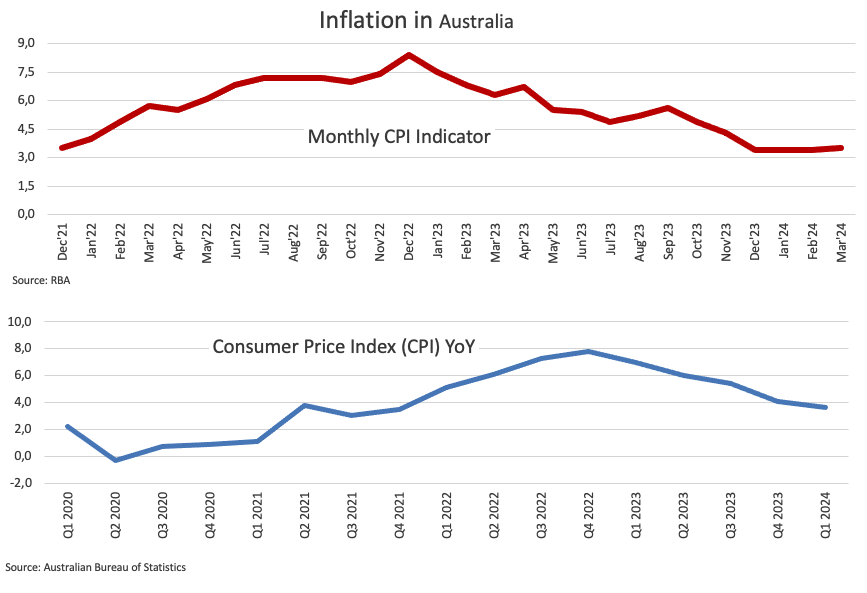
- Australian inflation figures surprised to the upside.

On Wednesday, the resumption of the buying interest on the US Dollar (USD) prompted AUD/USD to fade the initial push to the 0.6530 region, or multi-session highs, an area also coincident with the key 200-day SMA.
Turning to the Greenback, buyers seem to have returned to the market amidst rising US yields and unchanged expectations of potential interest rate hikes by the Federal Reserve (Fed), possibly deferred until the September meeting.
Moreover, the Australian dollar experienced humble gains amid a mixed sentiment in risk appetite, driven by reduced geopolitical tensions, while higher-than-expected inflation figures in Australia also bolstered the AUD.
Additionally, the rise in AUD coincided with another bullish movement in iron ore prices and the recovery in copper prices, which once again flirted with tops seen in March 2022.
In terms of monetary policy, the Reserve Bank of Australia (RBA) reiterated its commitment to maintaining current policies in the Minutes of its March meeting. Current market sentiment suggests a 90% probability of a 25 bps rate cut in 2024, compared to the roughly 50 bps of easing observed earlier this month.
Both the RBA and the Fed are among the last G10 central banks expected to consider interest rate adjustments this year.
Given the Fed's firm stance on tightening monetary policies and the potential for the RBA to initiate an easing cycle later in the year, AUD/USD is likely to face sustained downward pressure in the short and medium terms.
Furthermore, recent Chinese economic data has not provided strong indications of a lasting recovery, which is necessary to support a significant rebound in the Australian dollar.
AUD/USD daily chart
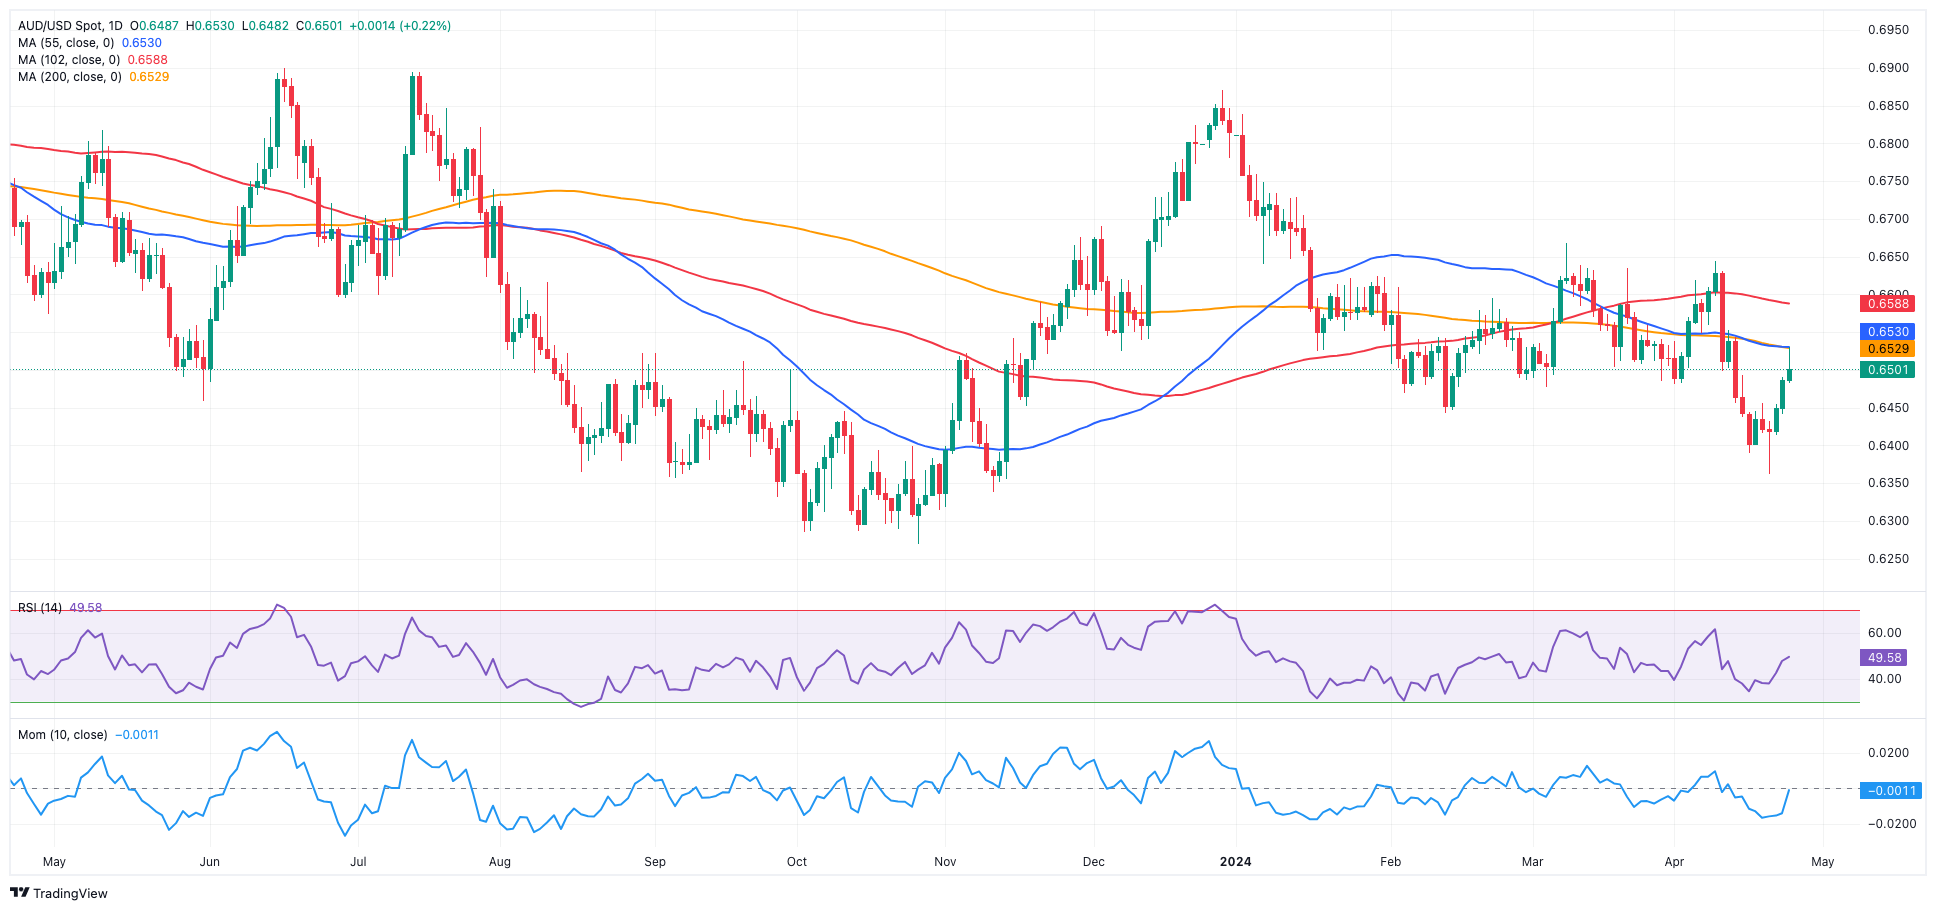
AUD/USD short-term technical outlook
Further rebound may see AUD/USD return to the significant 200-day SMA of 0.6527, which precedes the April high of 0.6644, followed by the March top of 0.6667 (March 8) and the December 2023 peak of 0.6871. Further north, the July high of 0.6894 (July 14) is slightly ahead of the June top of 0.6899 (June 16) and the crucial 0.7000 threshold.
Meanwhile, if sellers take control and the AUD/USD goes below its 2024 low of 0.6362 (April 19), spot might return to its 2023 bottom of 0.6270 (October 26) before hitting the round milestone of 0.6200.
Looking at the big picture, extra gains are likely on a sustained breakout of the key 200-day SMA.
On the 4-hour chart, the pair continues its recovery from recent annual lows. Nonetheless, the initial support level is 0.6362, followed by 0.6338. On the upside, 0.6529 provides immediate resistance before 0.6552. In addition, the RSI dropped to around 61.
Premium
You have reached your limit of 3 free articles for this month.
Start your subscription and get access to all our original articles.
Author

Pablo Piovano
FXStreet
Born and bred in Argentina, Pablo has been carrying on with his passion for FX markets and trading since his first college years.


