AUD/USD Forecast: Not out of the woods yet
- AUD/USD comes under renewed downside pressure.
- The US Dollar maintains its constructive outlook.
- US and Chinese inflation data and the FOMC event come next.
The persevering rise in the US Dollar (USD) this time weighed on the Australian dollar, forcing AUD/USD to give away part of Monday’s optimism and put the 0.6600 zone to the test once again on turnaround Tuesday.
The greenback's rebound was primarily fueled by heightened caution and renewed political worries in Europe following Sunday's parliamentary elections, all along with usual steady prudence ahead of the release of US inflation figures and the interest rate decision by the Federal Reserve (Fed), all expected on June 12.
Adding to the ongoing cautious stance, China will also release its CPI and Producer Prices prints early on Wednesday.
Additionally, extra weakness on the Aussie dollar came from the corrective decline in both copper and iron ore prices.
In terms of monetary policy, the Reserve Bank of Australia (RBA), like the Fed, remains one of the last major central banks to adjust its stance. Recent RBA Minutes indicated that officials are even considering the possibility of interest rate hikes if inflation rises.
Currently, money markets are predicting about 25 bps of easing by July 2025, with potential rate hikes still possible in August and September. Supporting this outlook, the RBA's Monthly CPI Indicator (Weighted Mean CPI) increased more than expected in April, rising to 3.6% from 3.5%.
Given the Federal Reserve's commitment to tightening and the likelihood that the RBA will maintain its restrictive stance for an extended period, AUD/USD is expected to further consolidate in the coming months.
On the Australian docket, Business Confidence gauged by NAB worsened to -3 in May (from 2).
AUD/USD daily chart
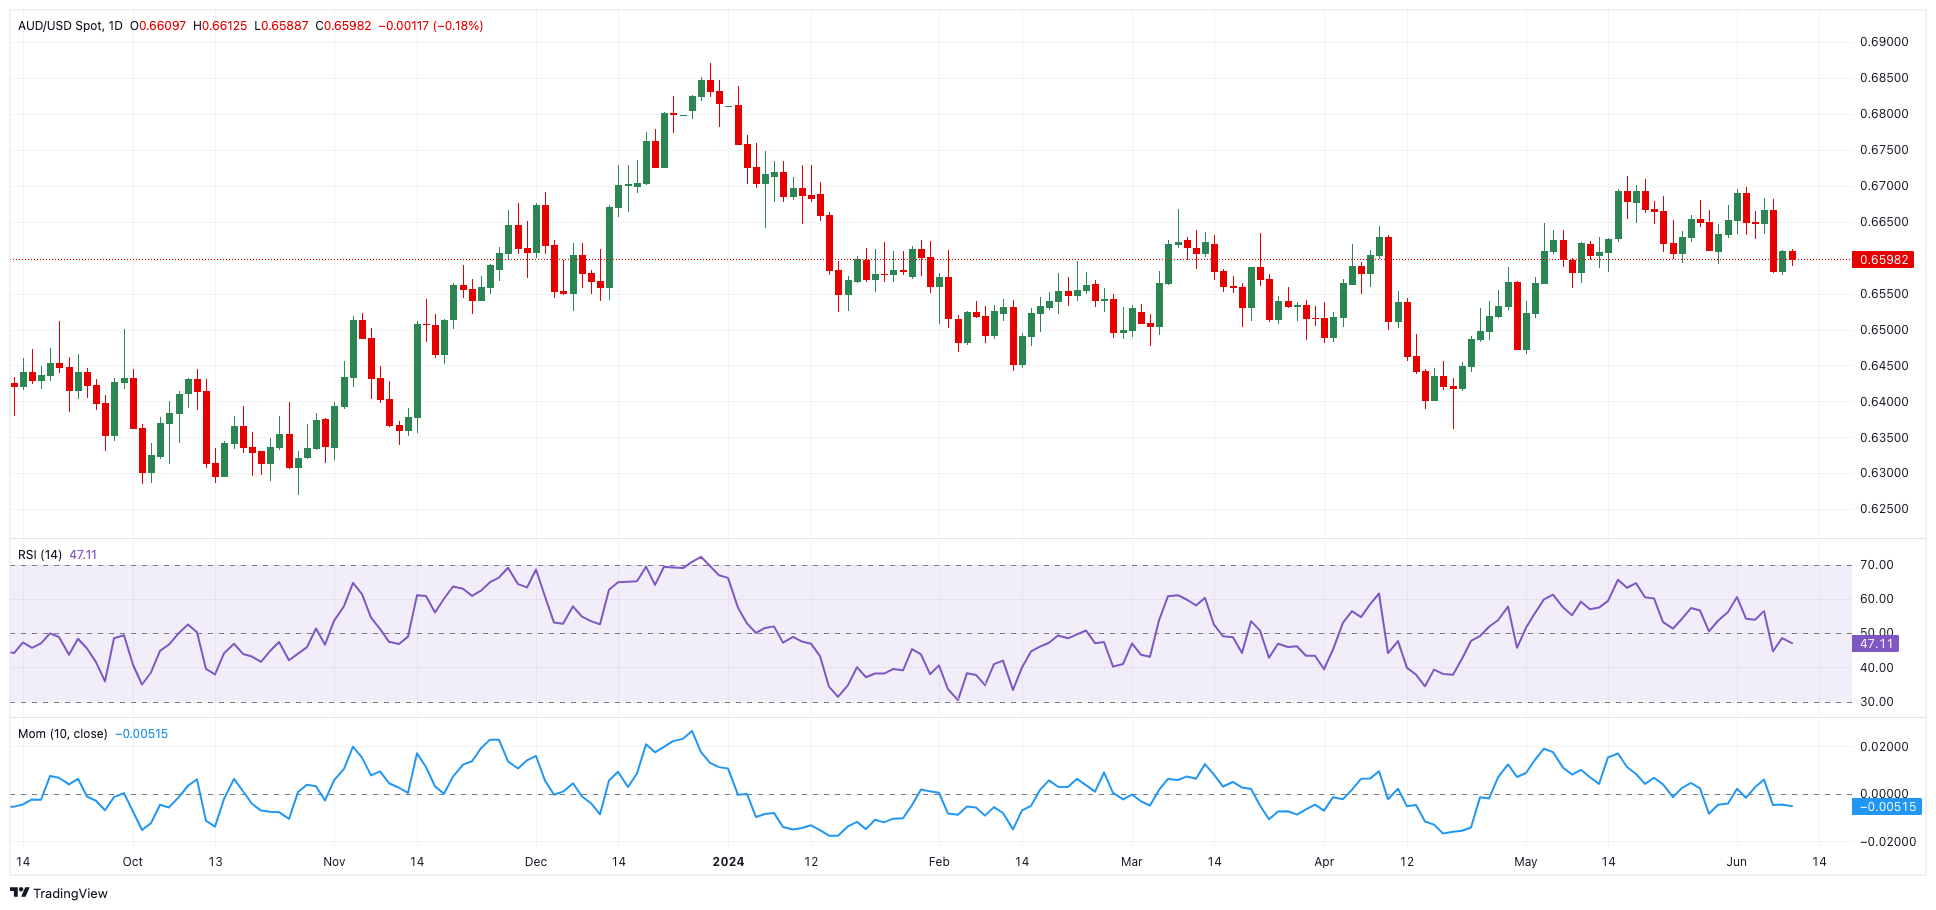
AUD/USD short-term technical outlook
Occasional bearish attempts may push AUD/USD towards the key 200-day SMA of 0.6539, ahead of the May low of 0.6465 and the 2024 bottom of 0.6362 (April 19).
The resumption of the upside bias may encourage spot to revisit the May peak of 0.6714 (May 16), followed by the December 2023 high of 0.6871 and the July 2023 top of 0.6894 (July 14), all before the critical 0.7000 level.
Overall, gains are likely if the price remains above the 200-day SMA.
The 4-hour chart shows some near-term consolidation for the time being. That said, immediate support occurs at 0.6574 before 0.6557. On the upside, the 200-SMA is at 0.6615, followed by 0.6698 and 0.6709. The RSI slipped back to around 40.
Premium
You have reached your limit of 3 free articles for this month.
Start your subscription and get access to all our original articles.
Author

Pablo Piovano
FXStreet
Born and bred in Argentina, Pablo has been carrying on with his passion for FX markets and trading since his first college years.


