AUD/USD Forecast: Further consolidation on the table
- AUD/USD kept its consolidation well in place on Tuesday.
- Gains in the Greenback kept AUD under downside pressure.
- The RBA’s Monthly CPI Indicator comes next on Wednesday.

AUD/USD resumed its downtrend and rapidly set aside Monday’s bullish attempt, maintaining its range-bound theme in the sub-0.6700 region well in place for yet another session on Tuesday.
Daily losses in the pair came in response to the rebound in the US Dollar (USD) as well as US yields across the curve, which maintained the price action around the risk-related universe subdued.
Adding to the sour sentiment in the Australian dollar, both copper prices and iron ore prices traded with humble losses, although well within their consolidation ranges.
Regarding monetary policy, the Reserve Bank of Australia (RBA), like the Fed, is among the last major central banks to alter its stance. At its last meeting, the RBA matched consensus and maintained a hawkish approach, keeping the official cash rate (OCR) at 4.35% and indicating flexibility for future decisions.
During her press conference, Governor Bullock confirmed that the board discussed possible rate hikes while ruling out cuts. Additionally, the bank remains focused on inflation, showing reluctance to ease policy unless necessary. The central bank emphasized that inflation is still above target and reiterated its commitment to taking the necessary actions to bring inflation back within the target range.
Furthermore, the swaps market currently estimates less than a 25% chance of a rate cut by December 2024, increasing to approximately 65% by February 2025.
The contrast between potential Fed easing and the RBA's likely prolonged restrictive stance could support AUD/USD in the next few months.
Meanwhile, unabated concerns about the slow momentum in the Chinese economy could hinder a sustained recovery in the Australian currency as China continues to face post-pandemic challenges.
AUD/USD daily chart
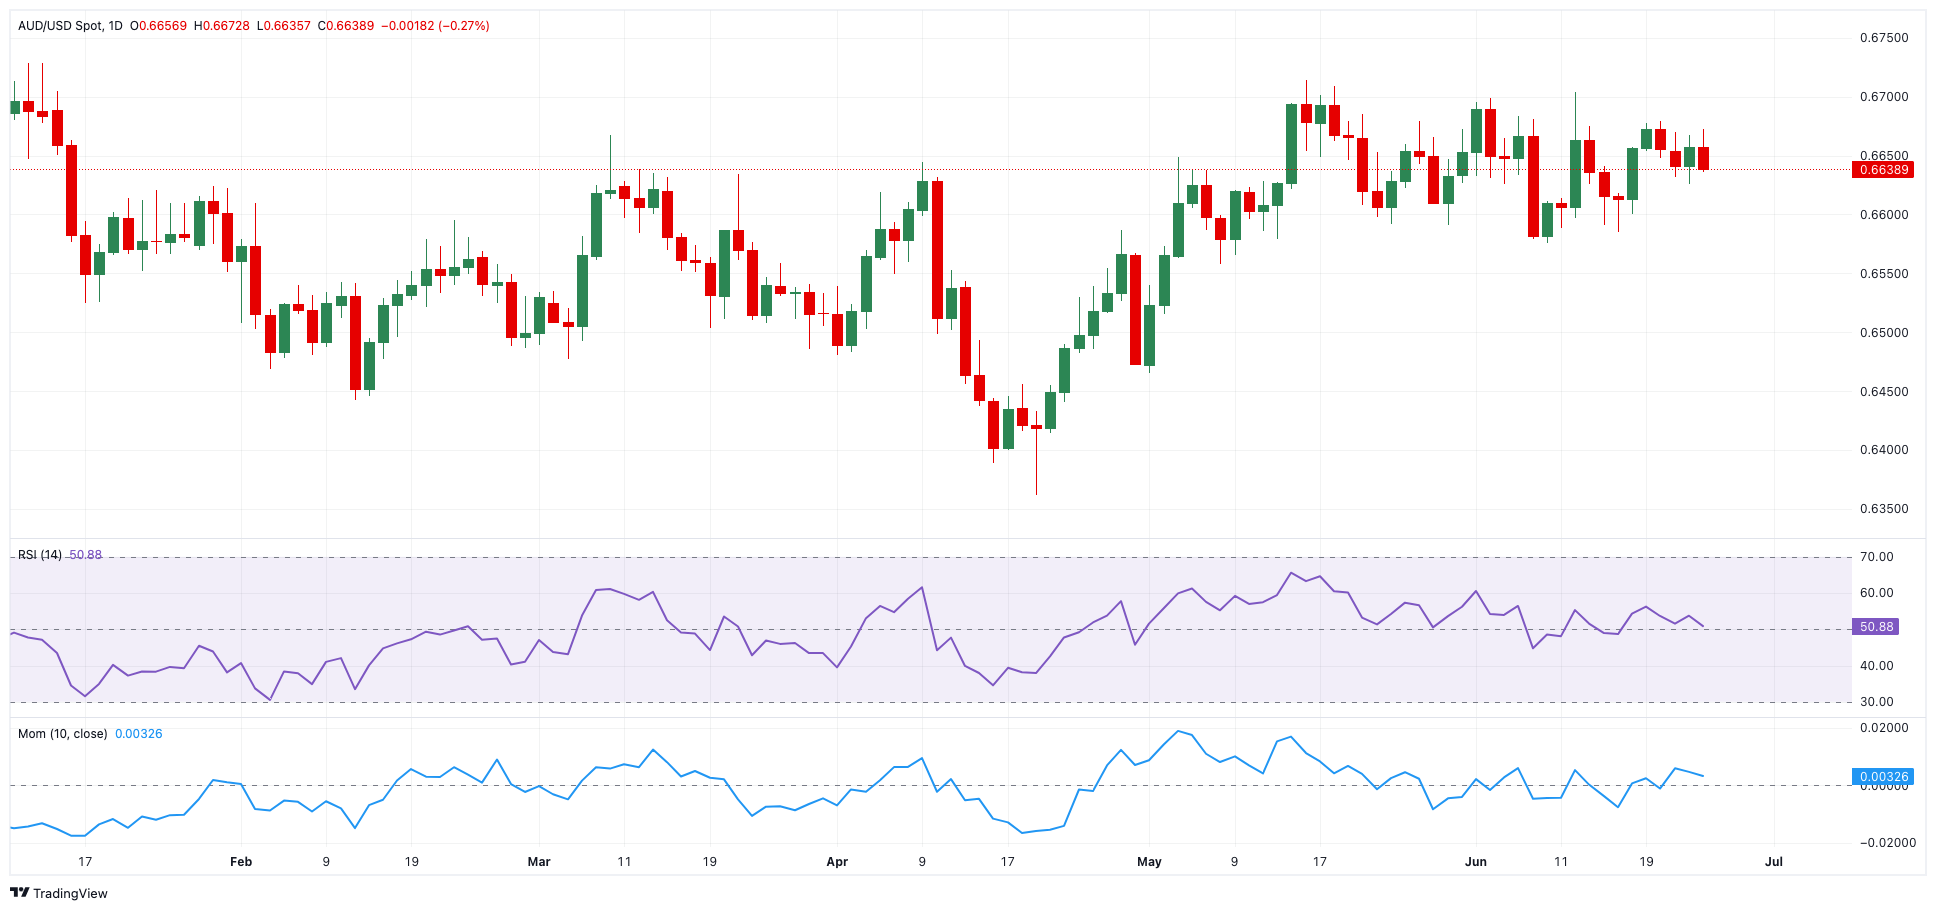
AUD/USD short-term technical outlook
If bulls take control, AUD/USD may reach its May peak of 0.6714 (May 16), followed by the December 2023 high of 0.6871 and the July 2023 top of 0.6894 (July 14), all before the key 0.7000 threshold.
Bearish attempts, on the other hand, may send the pair lower, first touching the June low of 0.6574 (June 10) before reaching the important 200-day SMA of 0.6551. A deeper decline might result in a return to the May low of 0.6465 and the 2024 bottom of 0.6362 (April 19).
In general, the uptrend should continue as long as the AUD/USD trades above the 200-day SMA.
The 4-hour chart indicates a lack of upward momentum thus far. However, the initial barrier appears to be 0.6714, which is ahead of 0.6728 and 0.6759. In contrast, immediate support is at 0.6574, followed by 0.6558. The RSI fell to around 43.
Premium
You have reached your limit of 3 free articles for this month.
Start your subscription and get access to all our original articles.
Author

Pablo Piovano
FXStreet
Born and bred in Argentina, Pablo has been carrying on with his passion for FX markets and trading since his first college years.


