AUD/USD Forecast: Focus shifts to the RBA… and 0.6700
- AUD/USD remained stuck within a consolidative theme below 0.6700.
- Discouraging Chinese data releases weighed on the AUD.
- The RBA is widely anticipated to keep its policy. Rate unchanged.
AUD/USD could not benefit from the small losses in the greenback and edged lower for the third session in a row at the beginning of the week, this time hovering around the 0.6600 neighbourhood.
The offered tone in the Greenback occurred despite the decent rebound in US yields, following investors' assessments of the Federal Reserve's hawkish hold and the likelihood that only one interest rate cut will occur this year, likely in December.
Contributing to the negative sentiment around the AUD, Chinese data published during early trade failed to surprise investors to the upside, showing a deteriorating housing sector, a yearly decline in industrial production, and a lower-than-expected growth in fixed asset investment.
Also, on the negatives for the Aussie dollar, copper prices remained on the back foot, while iron ore prices managed to clinch an acceptable bounce.
In terms of monetary policy, the Reserve Bank of Australia (RBA), like the Fed, is among the last major central banks to adjust its stance.
In light of the upcoming RBA meeting, investors have already ruled out any move on the bank’s Official Cash Rate (OCR), while money markets are predicting about 32 bps of easing by May 2025 (from 25 bps).
Given the prospects of the Fed easing its monetary policy later in the year vs. the likelihood that the RBA will maintain its restrictive stance for an extended period, AUD/USD could see potential gains in the short term.
AUD/USD daily chart
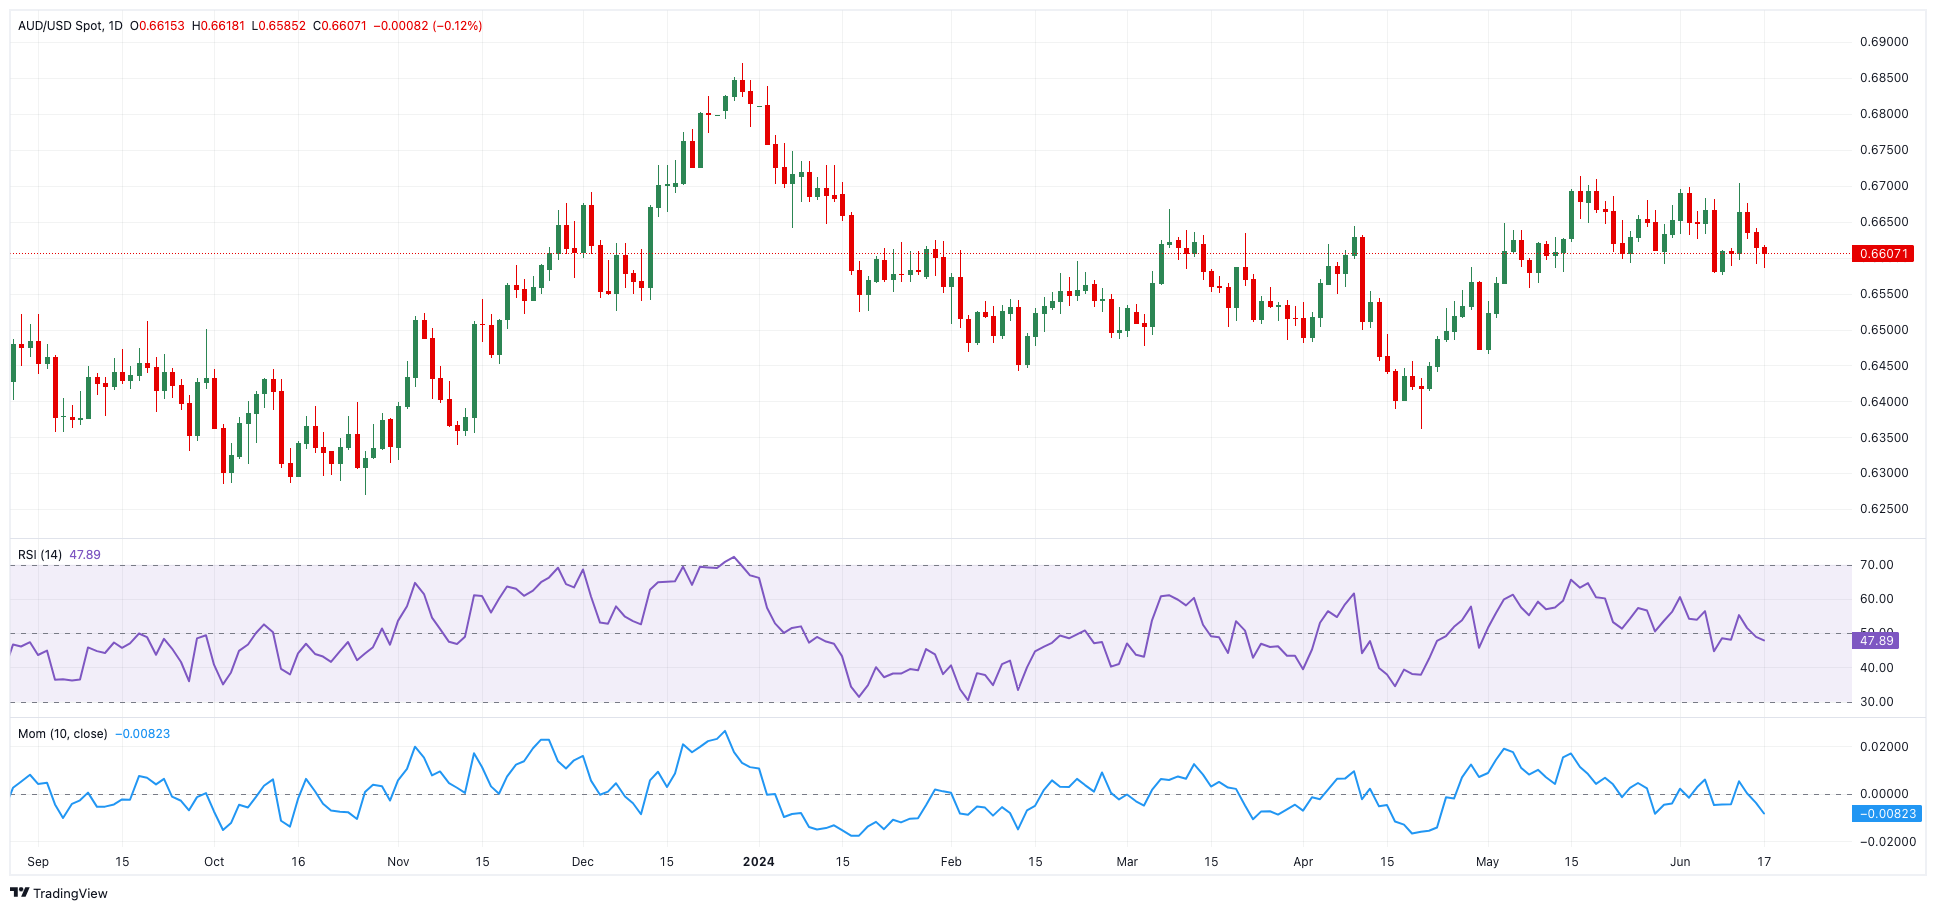
AUD/USD short-term technical outlook
Spot may revisit its May peak of 0.6714 (May 16), its December 2023 high of 0.6871, and its July 2023 top of 0.6894 (July 14), all before the crucial 0.7000 barrier, if the rising tendency resumes.
On the other hand, sporadic bearish attempts might force the AUD/USD pair to test the important 200-day SMA of 0.6544, which is ahead of the May low of 0.6465 and the 2024 low of 0.6362 (April 19).
In general, the positive outlook should hold until it is above the 200-day SMA.
The selling pressure is now accelerating on the 4-hour chart. Following that, the 200-SMA of 0.6628 comes first on the upside, ahead of 0.6574 and 0.6558. However, there is an instantaneous up-barrier at 0.6714, which comes before 0.6728 and 0.6759. The RSI rose past 45.
Premium
You have reached your limit of 3 free articles for this month.
Start your subscription and get access to all our original articles.
Author

Pablo Piovano
FXStreet
Born and bred in Argentina, Pablo has been carrying on with his passion for FX markets and trading since his first college years.


