AUD/USD Forecast: Bulls failed to regain the upper hand
- AUD/USD added to Tuesday’s retracement and revisited 0.6630.
- Another improvement in the Greenback kept the pair under pressure.
- Australia’s Q1 GDP Growth Rate disappointed expectations.

The continuation of the buying interest in the US Dollar (USD) sparked another negative session in AUD/USD, which flirted with four-day lows in the 0.6630-0.6625 band on Wednesday.
The upward impetus of the greenback was reinforced by firmer results from the key US ISM Services PMI in May, while investors continued to evaluate the likelihood of the Federal Reserve (Fed) beginning its easing plan later this year, possibly in November, with the second rate cut likely at the December meeting.
This optimism about rate cuts contrasted with previous cautious statements from some Fed policymakers, who stressed the need for more evidence of inflation approaching the Fed's target before considering rate reductions.
Other than the Dollar’s advance, daily losses in the Aussie dollar were also influenced by a marked pullback in iron ore prices, which contrasted with a small bounce in copper prices.
On the monetary policy front, the Reserve Bank of Australia (RBA), like the Fed, may be among the last major central banks to adjust its monetary policy. According to the bank’s latest Minutes, officials even discussed the potential for interest rate increases in the event that inflation picks up.
Currently, money markets anticipate about 25 bps of easing by May 2025, with rate hikes still possible in August. Favouring the bank’s tight stance, the RBA's Monthly CPI Indicator (Weighted Mean CPI) rose more than expected by 3.6% in April, up from 3.5%.
Given the Fed's commitment to tightening monetary policy and the likelihood that the RBA will maintain its restrictive stance for an extended period, AUD/USD is expected to consolidate further in the coming months.
AUD/USD daily chart
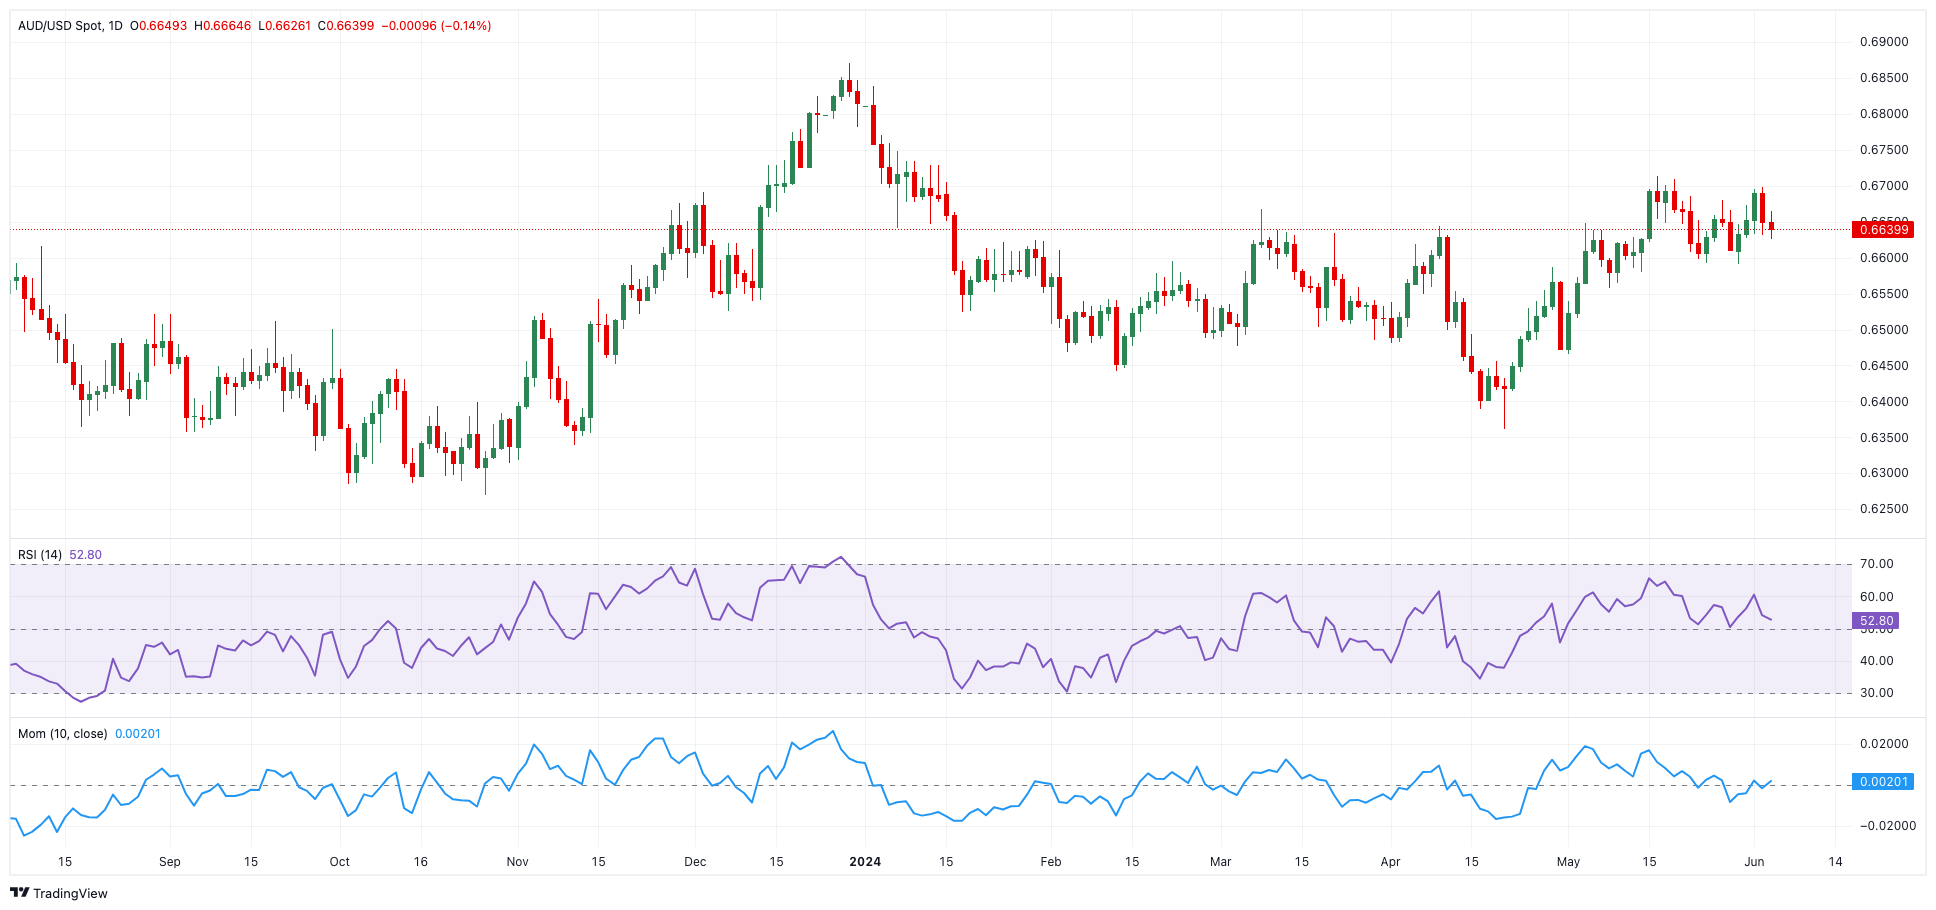
AUD/USD short-term technical outlook
Extra gains may lead the AUD/USD to seek the May high of 0.6714 (May 16), followed by the December 2023 top of 0.6871 and the July 2023 peak of 0.6894 (July 14), all ahead of the key 0.7000 level.
Meanwhile, bearish attempts may drive the pair to the intermediate 100-day and 55-day SMAs in the 0.6560-0.6570 zone, followed by the key 200-day SMA at 0.6536. The loss of the latter could result in a return to the May low of 0.6465 and the 2024 bottom of 0.6362 (April 19).
Overall, additional gains are expected as long as the price maintains above the 200-day SMA.
The 4-hour chart indicates a pick-up in the bearish trend. Nonetheless, 0.6698 is the first upward barrier, followed by 0.6709 and 0.6714. On the other side, 0.6590 offers quick support, followed by 0.6579 and 0.6557. The RSI fell to around 46.
Premium
You have reached your limit of 3 free articles for this month.
Start your subscription and get access to all our original articles.
Author

Pablo Piovano
FXStreet
Born and bred in Argentina, Pablo has been carrying on with his passion for FX markets and trading since his first college years.


